
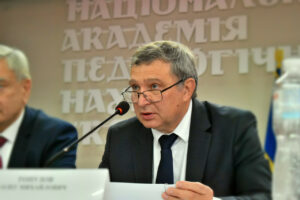
The General Assembly of the National Academy of Pedagogical Sciences of Ukraine elected Oleg Topuzov as president of the Academy for a five-year term—from September 18, 2026, to September 17, 2031.
According to the results of a secret ballot, 185 assembly members supported his candidacy, nine voted against, and two ballots were deemed invalid. Topuzov was the only candidate for the position.
He succeeded Vasily Kremen, who had led the academy since 1997. The General Assembly unanimously elected Kremen as honorary president of the National Academy of Pedagogical Sciences for life.
In presenting the academy’s development program, Topuzov outlined four core principles of operation: continuity, competence, openness, and effectiveness.
“My task is not to start from scratch. My task is to preserve the best of what we have and, together with you, to usher in a new phase of our academy’s development,” he stated.
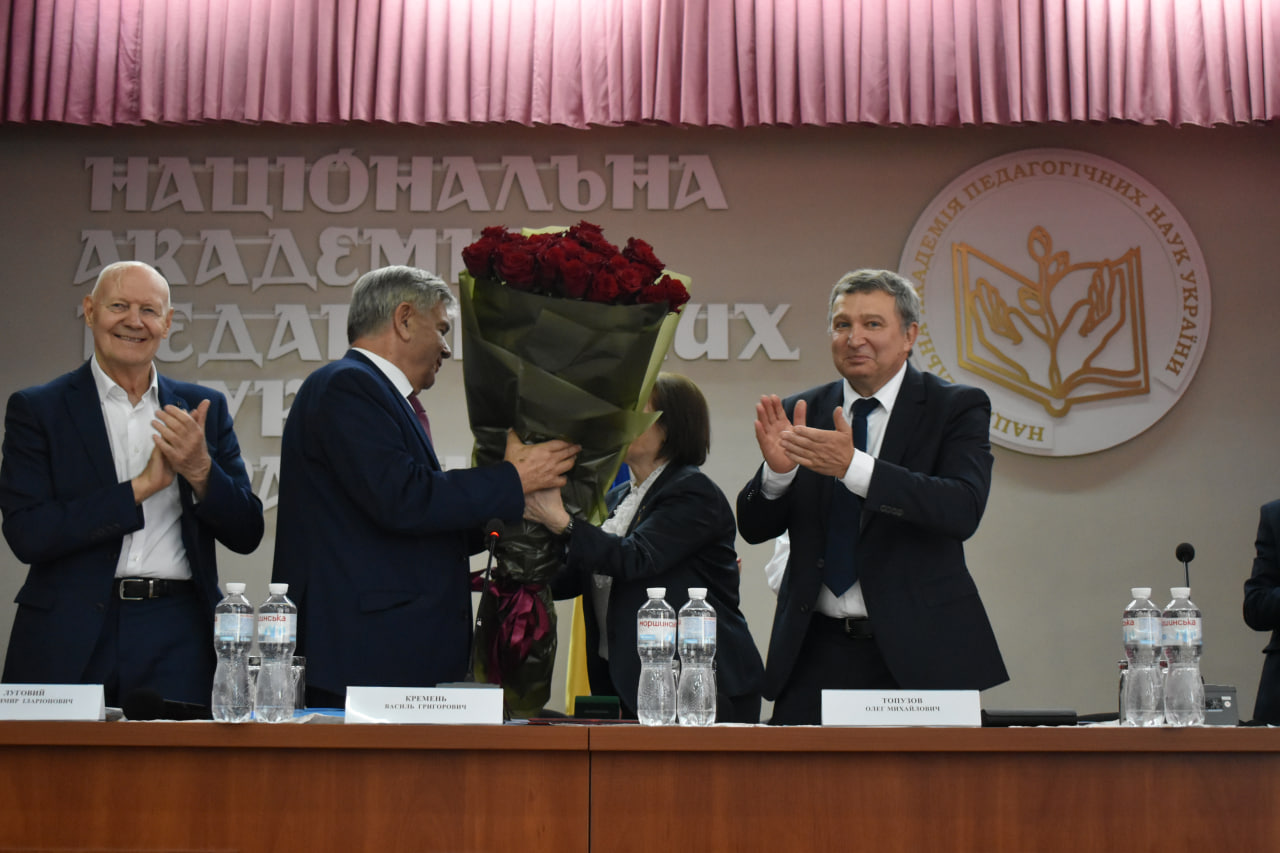
Among the main areas of focus for the new leadership, Topuzov highlighted strengthening the influence of educational science on the formation of state education policy, rebuilding human capital, overcoming educational gaps, supporting young scholars, and researching the impact of artificial intelligence on the education system.
One of the key initiatives is to be a systematic foresight study on the development of education in Ukraine through 2035. It will cover possible scenarios for the development of preschool, K-12, vocational, higher, and adult education, taking into account demographic changes, labor market needs, technological development, and European integration.
“Our research should not end with just monographs, articles, or recommendations. It must influence government decisions,” Topuzov emphasized.
He identified scientific support for education during wartime and postwar reconstruction as a separate priority. This refers, in particular, to the psychological resilience of children and youth, support for educators, inclusion, and the reintegration of veterans and Ukrainians returning from abroad.
According to the new president of the National Academy of Pedagogical Sciences, Ukraine’s recovery must begin with the restoration of human capital.
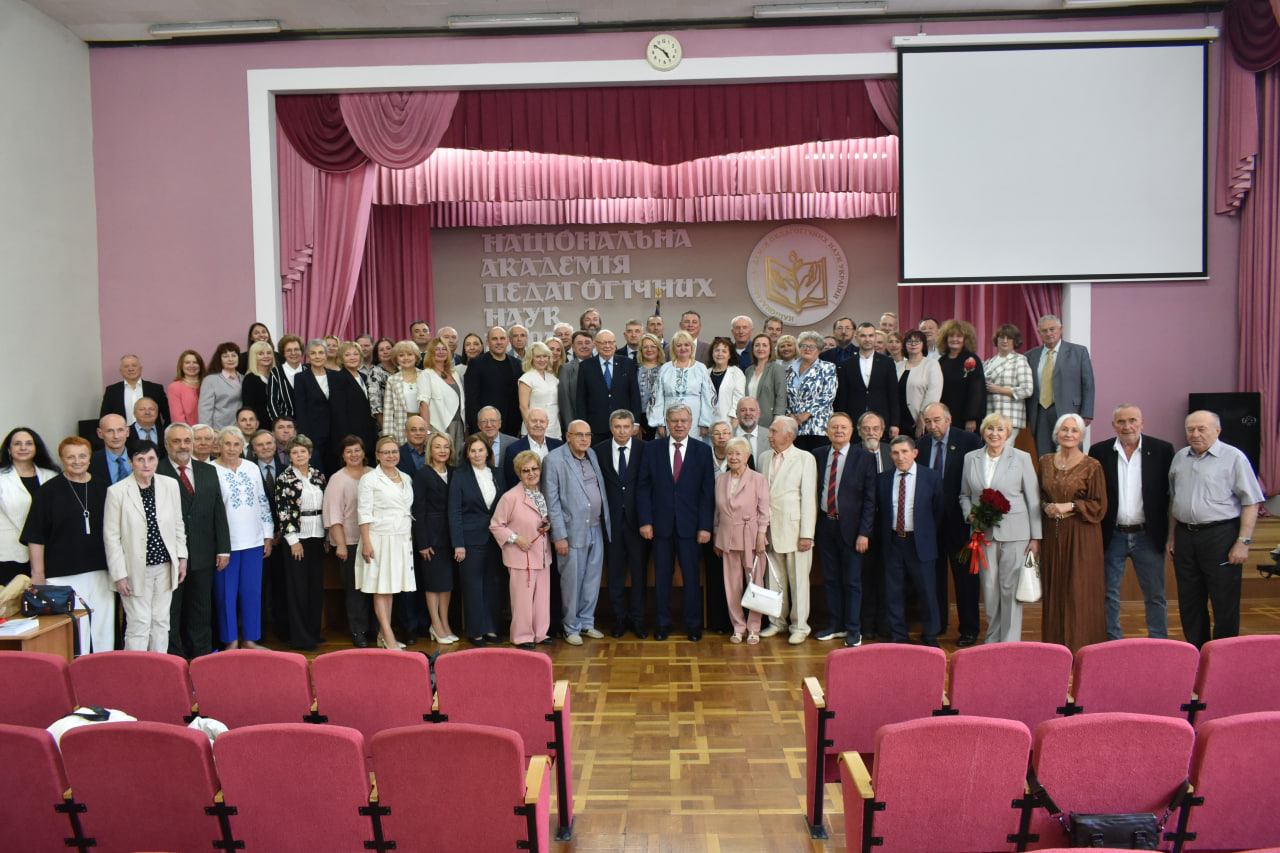
Topuzov also proposed launching a university-wide program titled “Artificial Intelligence and the Future of Education.” Research should cover changes in the role of teachers, approaches to assessing knowledge, issues of academic integrity, and the competencies students will need over the next 10–20 years.
The NAPN’s European integration will involve expanding joint research, participating in international consortia and programs such as Horizon Europe, Erasmus+, and COST, promoting academic mobility, and increasing the number of joint international publications.
For young researchers, there are plans to create the “Young Scientist of the National Academy of Pedagogical Sciences of Ukraine” program, which will provide grant support, mentorship, international mobility, and participation in major research projects.
During the annual meeting, the results of the NAPN’s activities for 2017–2026 were also presented. During this period, the Academy’s institutions completed 163 fundamental and 195 applied research projects, produced more than 14,000 scientific articles, and published over 250 monographs, preprints, and other scientific works.
The NAPN’s electronic library collection has grown to 40,000 full-text resources, and the number of downloads has reached 19 million. The Academy’s institutions participated annually in nearly 50 international scientific and educational projects and programs.
During the meeting, the Academy’s new leadership was also formed. Volodymyr Lugovoy and Vitaliy Panko were elected vice presidents of the National Academy of Pedagogical Sciences, and a new presidium was formed consisting of 29 members, 22 of whom had not previously served on it.
The National Academy of Pedagogical Sciences of Ukraine conducts fundamental and applied research in the fields of education, pedagogy, and psychology; participates in the development of educational standards, curricula, and textbooks; and provides scientific support for reforms in the education system.
The Inzhur Investment Group, which includes an asset management company with three investment funds, an investment firm, a securities broker, and a securities custodian, plans to increase its assets under management from the current 9.36 million UAH to 100 billion UAH over the next five years, said the group’s founder and head, Andriy Zhurzhii.
“100 billion is our dream and our plan. That’s for the next five years. In other words, we’ll end this year with more than 10 billion—10 to 11 billion in assets under management. And over the next five years, we’ll reach 100 billion based on today’s figures. In other words, if there are any devaluation processes, then, of course, we’ll get there faster,” he said during the “Forbes Business Breakfast with Fedorin” on Wednesday, adding that there was a day when the group managed to attract 500 million UAH at once.
According to him, the group has attracted 131,560 investors to its funds, with a minimum investment of 11 UAH.
“We’ve set ourselves the goal of reaching 1 million investors in ‘Inzhur’ by the end of 2028. We plan to end this year with 150,000–200,000 investors: we’re already on track for 170,000, and we’ll have to work hard to reach 200,000, but the team is doing its best,” noted Zhurzhii.
In his view, to increase the number of investors to 2–3 million, it is necessary to invest more in the community and in its education and experience; therefore, the group launched an educational program with Prometheus, which attracted 14,000 registrants in just one week.
The head of “Injur” also expressed the opinion that the Ukrainian market is not yet ready for stocks.
“We will still grow through some form of debt instruments—bonds or quasi-debt instruments, when we’re talking about funds. Stocks will be the next stage,” Zhurzhii believes.
asset, FUND, Injur, INVESTMENT, INVESTOR
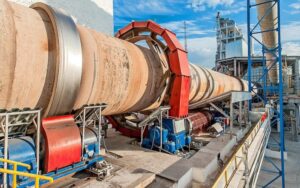
Taiwan Cement Corporation (TCC Group) intends to acquire 100% of the shares in the Ukrainian cement producer PJSC “Ivano-Frankivskcement” (“IFCEM”), the company’s press office reported.
“The partnership will combine IFTSEM’s leading position in the Ukrainian market, its modern production facilities, long-standing industrial traditions, and strong team with TCC’s global experience, technologies, and investment capabilities. It lays the foundation for the group’s further development and its active participation in Ukraine’s large-scale recovery and the deepening of economic integration with Europe,” according to a statement on the “Ivano-Frankivskcement” website.
The relevant agreement will be concluded between the majority shareholder of PrJSC “Ivano-Frankivskcement,” CemInWest S.A. (Switzerland), together with the owners of the affiliated companies Ivano-Frankivskdakh LLC, Krugips LLC, Krumix LLC, and TCC Group EMEA Holdings B.V. (Netherlands)—a subsidiary of TCC Group Holdings Co., Ltd.
It is noted that the completion of the transaction is subject to obtaining the necessary antitrust approvals and other regulatory clearances in the relevant jurisdictions, as well as the fulfillment of standard closing conditions.
According to Mykola Kruts, Chairman of the Management Board and member of the Supervisory Board of “Ivano-Frankivskcement,” he will remain a member of the company’s board of directors in the coming years.
“Today, the company is entering a new phase of its development. The partnership with a global strategic investor from Taiwan opens up new opportunities for IFCEM in terms of investment, technological development, and further strengthening of its position. In the coming years, I will remain a member of the board of directors to ensure continuity, stability, and the company’s further development,” the company quotes Krut as saying in its statement.
The preliminary value of the deal is approximately 750 million euros, according to “Forbes Ukraine,” citing Focus Taiwan.
PJSC “Ivano-Frankivskcement” manufactures cement, roofing materials, concrete and reinforced concrete products, and dry construction mixes. Its production capacity stands at 4.3 million metric tons of cement per year. Approximately 2,500 people are employed at the group’s facilities.
Before the start of the full-scale war, NEQSOL Holding was close to acquiring “Ivano-Frankivskcement,” but subsequently withdrew from the deal.
According to data from the YouControl analytical system, in 2025, Ivano-Frankivskcement increased its net profit by a factor of 1.4 compared to the previous year, to 4.2 billion UAH, and its net revenue by 20.3%, to 16.2 billion UAH. In the first half of 2026, net profit decreased by a quarter compared to the same period in 2025, to 1.4 billion UAH, while net revenue fell by 4.2%, to 7.1 billion UAH. The company’s total assets amounted to 14.9 billion UAH.
TCC Group Holdings Co., Ltd. is a global industrial group based in Taiwan and one of the world’s largest cement producers. The group operates more than 40 production sites, with a combined cement production capacity exceeding 112 million metric tons per year, and employs 13,800 people. TCC is also developing initiatives in green energy, energy storage systems, and advanced materials. TCC has a significant presence in Europe and Africa, particularly in Portugal, Turkey, Spain, the United Kingdom, the Netherlands, France, and Italy.
AGREEMENT, CEMENT, INVESTMENT, IVANO-FRANKIVSKCEMENT, TCC Group
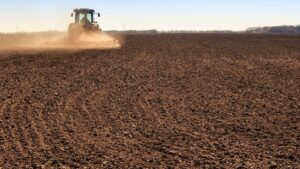
As of September 23, Ukrainian farmers had planted 741,400 hectares with winter grains, or 14.2% of the projected area, and 958,800 hectares with winter rapeseed, or 86.7% of the projection, according to the press service of the Ministry of Agrarian Policy and Food.
Specifically, 662,400 hectares (14.6% of the forecast) have been planted with wheat and triticale (a hybrid of wheat and rye – IF-U), 53,100 hectares (8.9%) with barley, and 25,800 hectares (33.6%) with rye.
The largest areas of winter grains have been planted in the Mykolaiv region—101,000 hectares, including 79,000 hectares of wheat and triticale and 22,000 hectares of barley.
In the Poltava region, 91.3 thousand hectares have been planted, of which 87.3 thousand hectares are wheat and triticale, and 4 thousand hectares are rye.
In the Dnipropetrovsk region, 86,300 hectares have been planted with winter grains, including 84,000 hectares of wheat and triticale, 2,100 hectares of barley, and 200 hectares of rye.
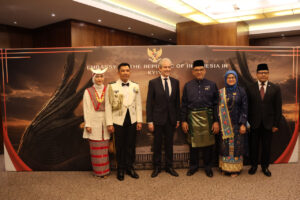
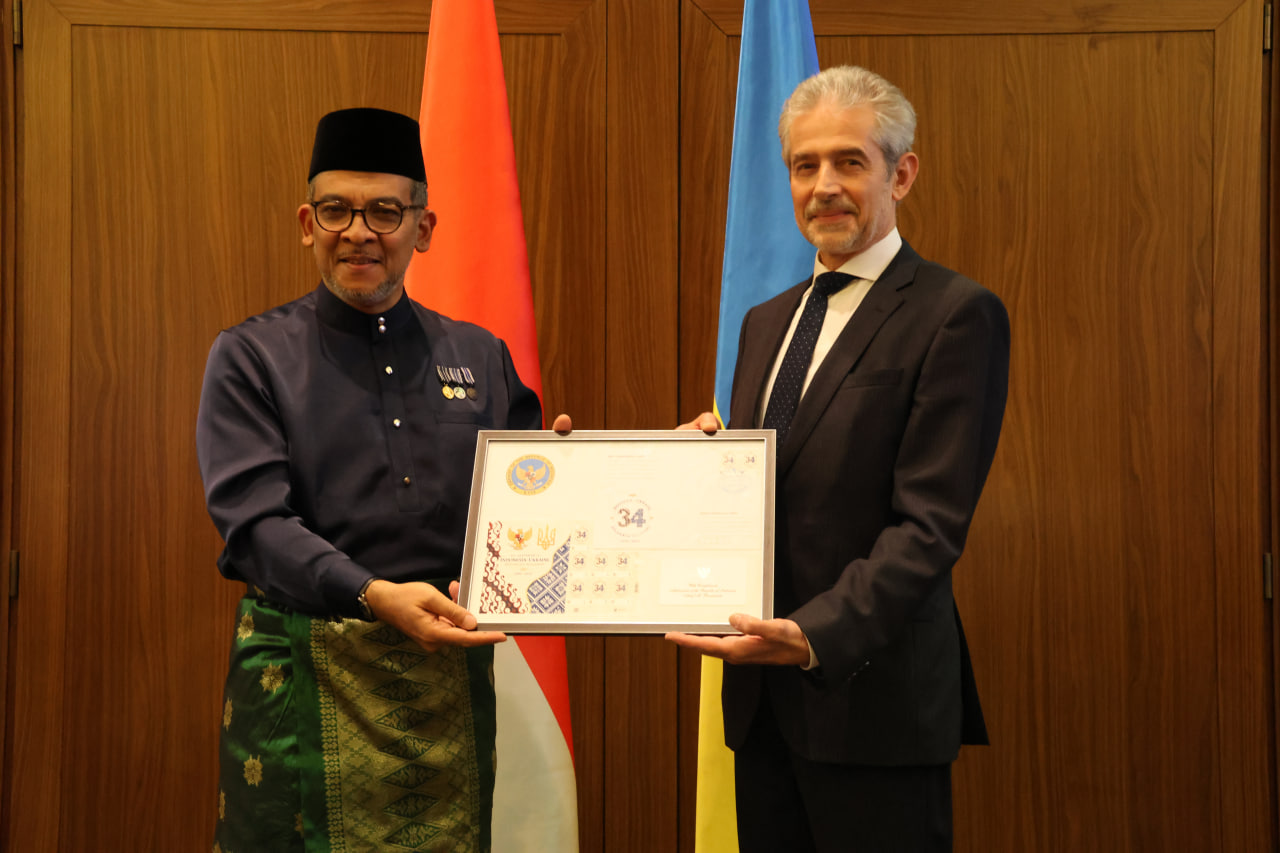
Indonesia is ready to expand practical cooperation with Ukraine, particularly in trade, investment, critical minerals, science, and the country’s future recovery, said Arif Muhammad Basalamah, Ambassador of the Republic of Indonesia to Ukraine.
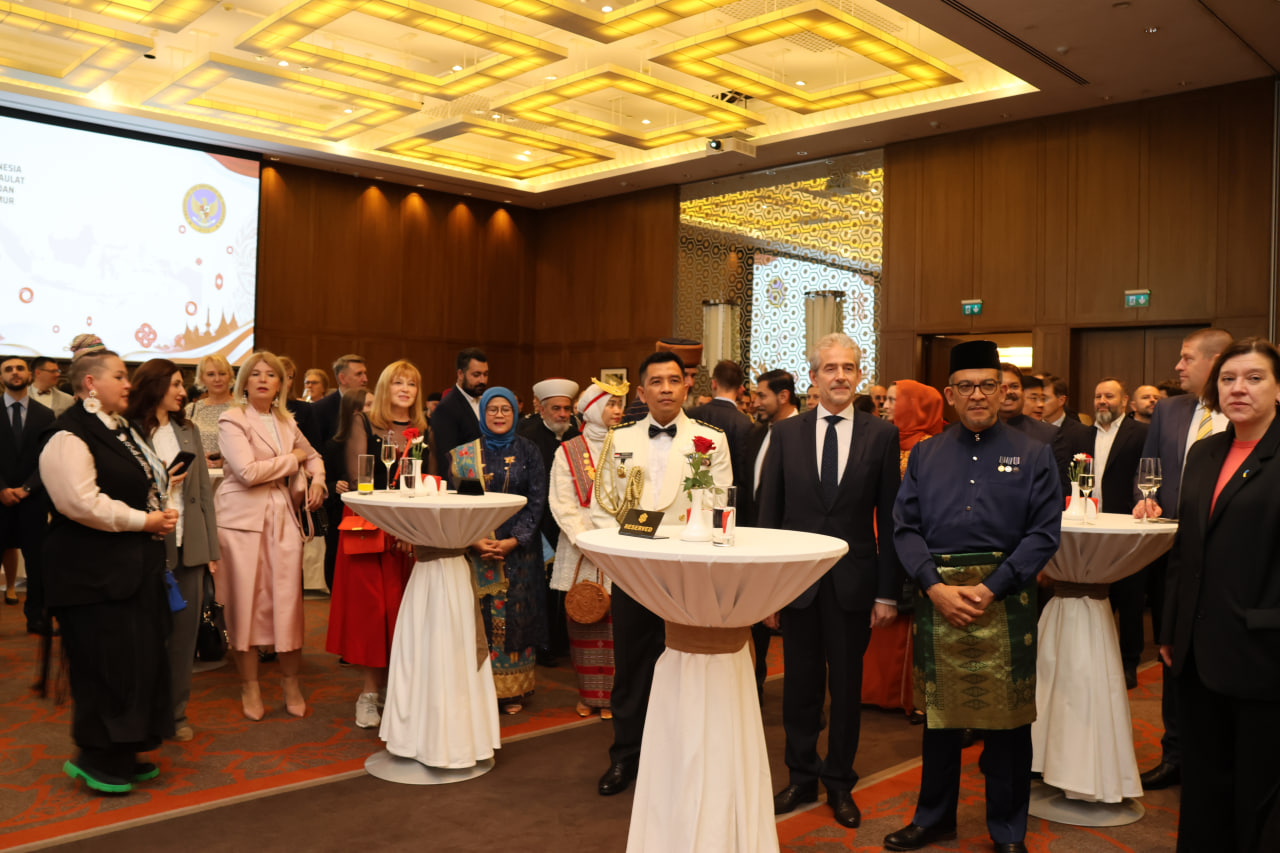
“Indonesia is ready to explore practical areas of cooperation that can contribute to recovery and reconstruction, while opening up new opportunities for our bilateral partnership,” he said during a diplomatic reception in Kyiv marking the 81st anniversary of Indonesia’s independence.
The reception took place on September 22 and was attended by representatives of the Ukrainian government, the diplomatic corps, international organizations, the business community, and the Indonesian community. In his speech, the ambassador specifically congratulated Andriy Dronyuk, Ukraine’s Deputy Minister of
Foreign Affairs for Digital Development, Digital Transformation, and Digitalization, and Artem Kunaev, chair of the Ukraine-Indonesia Interparliamentary Friendship Group.
Basalamah noted that, despite the war, political dialogue between the countries remains active, and cooperation continues to expand. At the same time, bilateral trade in 2025 fell to $492.6 million compared to a peak of $1.45 billion in 2021.
“We see opportunities to develop new areas of cooperation and to more fully realize the potential of a mutually beneficial economic partnership,” the ambassador emphasized.
According to him, one such new area could be critical minerals and rare earth elements, where the parties see opportunities for research, technological cooperation, and future business projects. The Indonesian side is also interested in more active interaction between businesses from both countries in trade, investment, and joint production.
The ambassador invited Ukrainian companies to participate in Trade Expo Indonesia 2026, which will take place October 14–18 and is expected to serve as a platform for establishing contacts with Indonesian exporters and potential investment partners.
Basalamah identified tourism as another area for expanding ties. According to him, more than 18,000 Ukrainian citizens had already visited Indonesia by 2026.
“We hope that as transportation links improve and when circumstances permit, more Ukrainians will have the opportunity to discover Indonesia—its natural beauty, cultural heritage, and diverse culinary traditions,” the diplomat said.
The ambassador also highlighted the intensification of educational and scientific ties. He noted that in 2026 alone, the Indonesian Embassy in Kyiv facilitated the signing of four agreements between universities in Ukraine and Indonesia. Ukrainian students can also study in Indonesia through the Darmasiswa and KNB Scholarship programs.
In addition, Indonesia’s National Agency for Research and Innovation and Ukraine’s National Antarctic Scientific Center recently signed an agreement on cooperation in the field of Antarctic and tropical research. The document opens up opportunities for joint research projects and scientific exchange.
Speaking about the war, Basalamah noted that Indonesia continues to advocate for the use of dialogue and diplomacy to achieve lasting peace, as well as adherence to the principles of the UN Charter.
“Peace means that people can live in safety, rebuild their communities, provide education for their children, and look to the future with hope,” he said.
Diplomatic relations between Ukraine and Indonesia were established on June 11, 1992, several months after Indonesia recognized Ukraine’s independence on December 28, 1991.
The Embassy of the Republic of Indonesia in Kyiv began operations in January 1994. Currently, Arif Muhammad Basalamah serves as Indonesia’s Ambassador Extraordinary and Plenipotentiary to Ukraine.
The Embassy of Ukraine in Jakarta was opened in the second half of the 1990s; the official opening of the diplomatic mission took place on May 16, 1997. Currently, the position of Ambassador Extraordinary and Plenipotentiary of Ukraine to Indonesia is vacant. Following the conclusion of Vasyl Hamyanin’s mission, the
Ukrainian Embassy in Jakarta has been headed by Yevheniia Shynkarenko, Chargé d’Affaires ad interim of Ukraine. As of September 2026, she continued to serve as the head of the Ukrainian diplomatic mission in Indonesia.
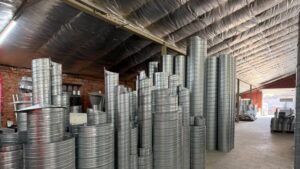
The Lviv Ventilation Plant (LVP) has completed construction of the second phase of its production facilities and plans to install equipment by the end of 2026 that will allow the plant to double its production volume, according to Dmytro Kysilevsky, deputy chair of the parliamentary committee on economic development.
“The Lviv Ventilation Plant has completed construction of the second phase of its production facilities. The equipment has already been purchased and, according to the plan, will be installed by the end of 2026. The investment in the plant’s second phase totaled approximately $1.5 million,” he wrote on Facebook on Wednesday.
Kisilevsky noted that to implement the project, the plant utilized tools from the “Made in Ukraine” policy, specifically the “5-7-9” affordable loan program, as well as a grant for equipment for the processing industry. In addition, the plant is preparing to participate in the state program that compensates 15% of the cost of Ukrainian-made equipment.
According to the MP, in 2025, production volumes at the Lviv Ventilation Plant increased by 30% and have remained at the same level this year.
“The company has a full production cycle and currently processes about 55 metric tons of sheet metal per month. Investments totaling $2.5 million are planned for the construction of the plant’s third phase,” he added.
Kysilevsky also noted that the plant’s investors previously engaged in importing ventilation equipment but have now shifted their focus to developing production in Ukraine—the launch of the plant’s first phase, with investments of approximately $1 million, took place in 2022, a few months after the full-scale invasion.
The Lviv Ventilation Plant manufactures air ducts, sound absorbers, and components for ventilation systems designed for use in industry, retail, hotels, and business centers.
According to data from YouControl, in 2025 the plant increased its net sales revenue by 20% compared to the previous year—to 50.1 million UAH—while net profit decreased by 34.6%—to 1.6 million UAH. In the first half of this year, net revenue amounted to 19.6 million UAH, and net profit was 0.71 million UAH.
Serhiy Vozgomenchuk, a resident of the Rivne region, owns 100% of the company’s shares and serves as its CEO.



