According to Experts Club, Ukrainians’ attitudes toward Algeria in August 2026 remain predominantly neutral—65.8% of respondents hold this view. At the same time, compared to March, the share of positive assessments has increased significantly—to 14.3%, while negative assessments have risen to 12.2%, reports the Experts Club Information and Analytical Center.
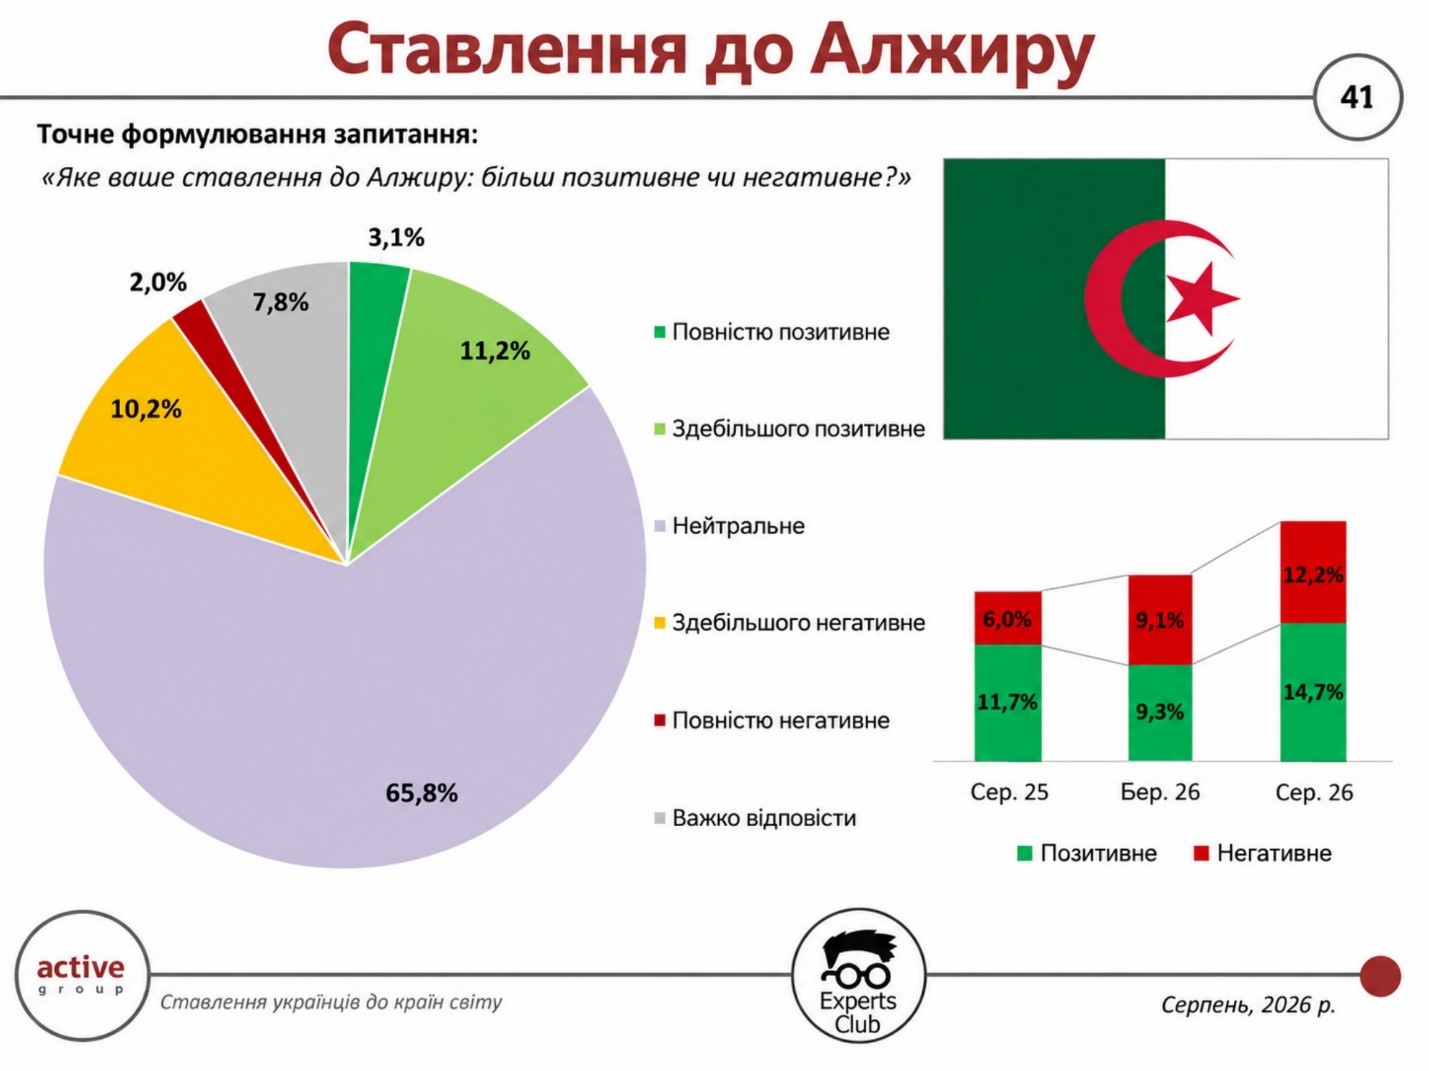
According to the results of the August survey, 3.1% of Ukrainians have a completely positive attitude toward Algeria, while 11.2% have a mostly positive attitude. 65.8% of respondents chose a neutral response. 10.2% expressed a mostly negative attitude, 2% a completely negative one, and another 7.8% were undecided.
Based on rounded figures, the balance between positive and negative assessments stands at approximately plus 2.1 percentage points. Thus, positive assessments only slightly outweigh negative ones, and the main characteristic of perceptions of Algeria remains the high proportion of neutral responses.
In March 2026, public opinion was even less defined. At that time, 74.1% of respondents had a neutral attitude toward Algeria. The overall positive rating in the survey was 9.3%, the negative rating was 9.1%, and 7.5% of respondents were undecided.
Thus, over the course of five months, the share of positive assessments increased by approximately 5 percentage points—to 14.3%—while the share of negative assessments rose by 3.1 percentage points, to 12.2%. The most notable change was the decline in the neutral segment—by 8.3 percentage points, from 74.1% to 65.8%. At the same time, the balance of attitudes rose from approximately plus 0.2 percentage points to plus 2.1 percentage points.
This trend indicates the gradual formation of a more defined attitude toward Algeria: some respondents who previously held a neutral position have shifted to either the positive or negative segments. At the same time, nearly two-thirds of Ukrainians still do not express a clear emotional assessment of the country.
Algeria is one of Ukraine’s trading partners with which it maintains a significant trade surplus. In the first half of 2026, Ukrainian exports to Algeria totaled approximately $388.6 million, imports amounted to $79.3 million, and the trade surplus was about $309.2 million. Agricultural products form the bulk of Ukrainian exports to this market.
Maksym Urakin, founder of the Experts Club information and analytical center and a candidate of economic sciences, has previously drawn attention to the gap between the general public’s limited awareness of Algeria and the actual economic interaction between the two countries.
“Despite relatively weak public interest, Ukraine and Algeria have a significant level of trade interaction. In 2025, bilateral trade exceeded $401 million,” Urakin noted.
He also emphasized that the significant surplus of Ukrainian exports over imports creates an economic foundation for the further development of bilateral relations.
The latest wave of the study shows that public perception of Algeria is gradually becoming more defined, but so far lags significantly behind the country’s actual economic role. Despite a trade surplus favorable to Ukraine, nearly 66% of respondents continue to view Algeria neutrally.
The previous survey was conducted in March 2026 among 800 Ukrainian citizens aged 18 and older using self-administered online questionnaires on the SunFlowerSociology panel. The sample was representative by age, gender, and region; the maximum theoretical margin of error for indicators at the 50% confidence level was ±3.5 percentage points.
ACTIVE GROUP, ALGERIA, EXPERTS CLUB, FOREIGN TRADE, international relations, NORTH AFRICA, PUBLIC OPINION, SOCIOLOGY, UKRAINE
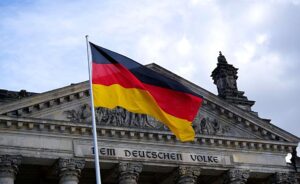
Germany remains one of the countries with a high level of positive perception among Ukrainians; however, in August 2026, this figure dropped significantly compared to the previous survey wave. According to the results of a survey by Active Group and Experts Club, 69.9% of respondents have a positive attitude toward Germany, while 5.5% have a negative one, reports the Experts Club Information and Analytical Center.
According to the August survey, 26.8% of Ukrainians view Germany entirely positively, and 43.1% view it mostly positively. A neutral stance was held by 23.5% of respondents. A mostly negative attitude was expressed by 4.9%, a completely negative one by 0.6%, and another 1.2% were undecided.
The balance of positive and negative assessments stands at plus 64.4 percentage points. This keeps Germany among the countries with a distinctly positive perception, although the figure is lower compared to previous surveys. In August 2026, Germany ranked behind France and the Netherlands among Western European countries in terms of the share of positive attitudes.
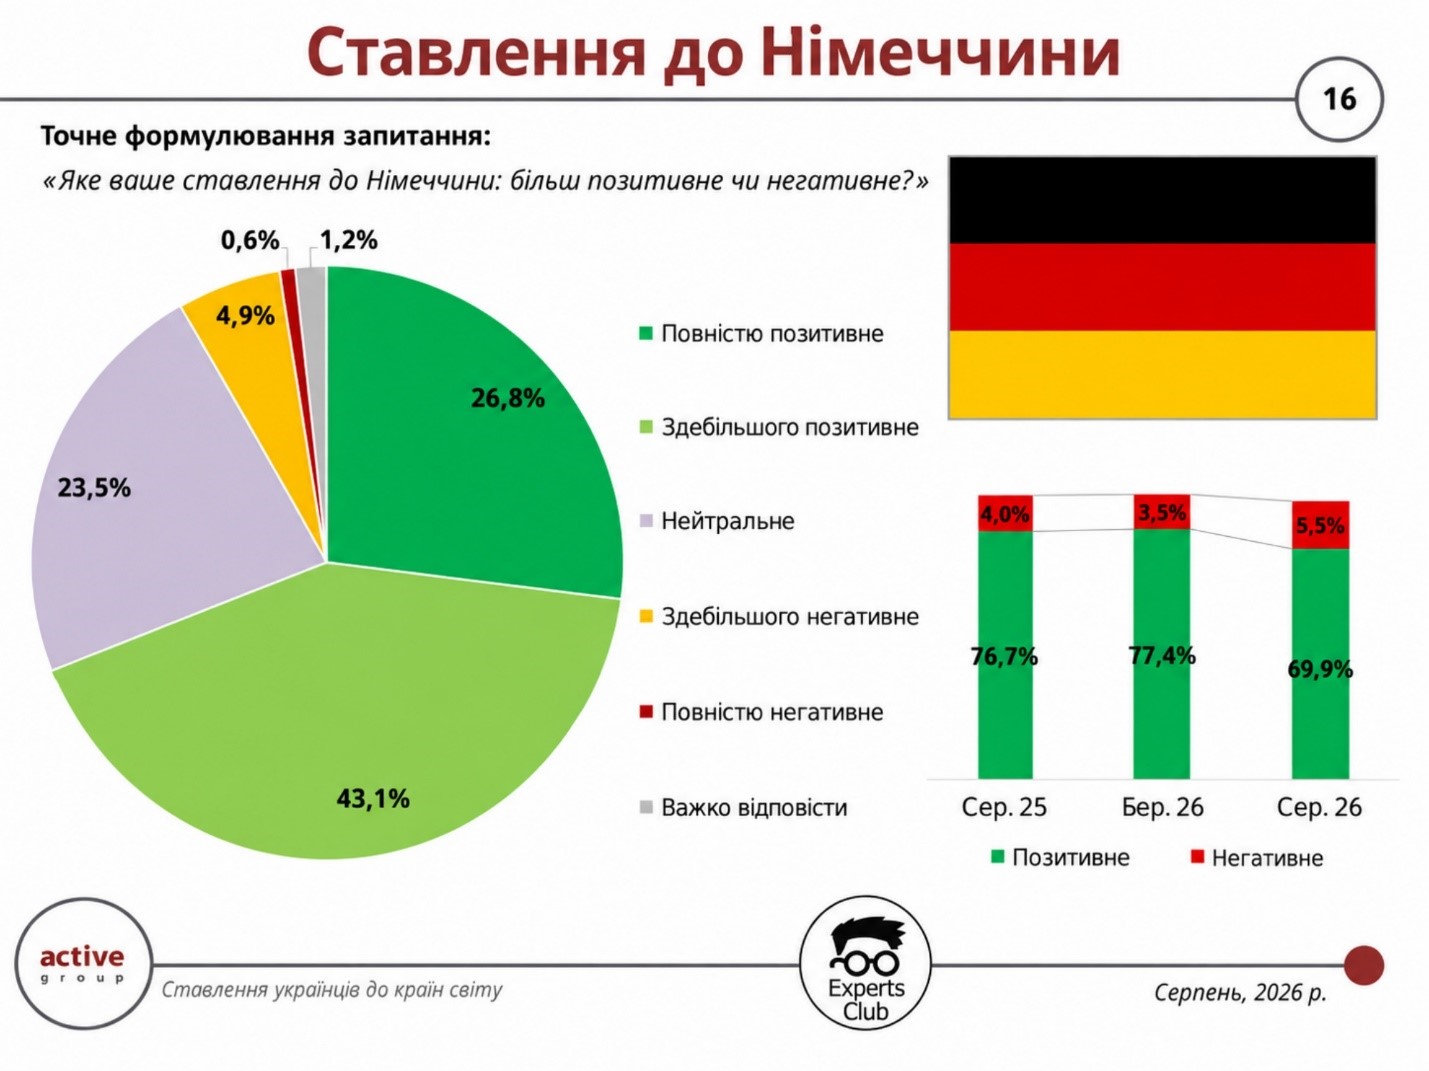
In March 2026, 77.4% of respondents viewed Germany positively: 32.9% viewed it entirely positively and 44.5% viewed it mostly positively. Negative assessments accounted for only 3.5%, while 18.4% of respondents chose a neutral response.
Thus, over the course of five months, the share of positive assessments decreased by 7.5 percentage points—from 77.4% to 69.9%—while negative assessments increased by 2 percentage points—from 3.5% to 5.5%—and neutral assessments rose by approximately 5.1 percentage points. The balance between positive and negative assessments fell from 73.9 to 64.4 percentage points. However, positive attitudes still outnumber negative ones by nearly 13 to 1.
At the same time, Germany remains one of Ukraine’s largest trading partners. In the first half of 2026, Ukrainian exports to Germany totaled approximately $1.267 billion, imports amounted to $3.208 billion, and total trade volume reached about $4.48 billion. The trade deficit for Ukraine amounted to approximately $1.94 billion. Ukraine’s main exports included cable products, rapeseed, furniture, soybeans, and metal pipes, while imports from Germany consisted of automobiles, pharmaceuticals, petroleum products, and agricultural machinery.
Oleksandr Pozniy, director of the research firm Active Group, commenting on Ukrainians’ high regard for Germany in the previous wave of the survey, attributed it to a combination of factors that go beyond purely economic relations.
“Germany is viewed as a strategic ally in the political and security spheres. Hundreds of thousands of Ukrainian refugees have found shelter there, and large-scale financial and military aid plays a key role in the resilience of our state. The combination of these factors explains why more than three-quarters of Ukrainians view Germany positively and why this country remains among the undisputed leaders in terms of trust within our society,” Pozniy noted.
The new wave of the survey shows that the level of positive attitudes toward Germany has declined compared to the spring, but there has been no fundamental change in the structure of public opinions: positive responses continue to significantly outnumber negative ones, and the main increase occurred not in the category of negative attitudes but in that of neutral ones.
The survey was conducted in August 2026 using an online self-administered questionnaire via the SunFlowerSociology panel among 800 Ukrainian citizens aged 18 and older. The sample is representative by age, gender, and region; the maximum theoretical margin of error for indicators at the 50% confidence level is ±3.5 percentage points.
ACTIVE GROUP, EXPERTS CLUB, FOREIGN TRADE, GERMANY, international relations, Pozniy, PUBLIC OPINION, SOCIOLOGY, UKRAINE
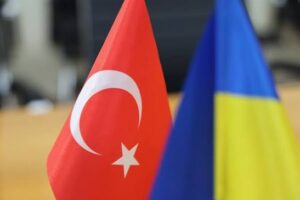
Turkey continues to enjoy a predominantly positive perception among Ukrainians: in August 2026, a total of 52.3% of respondents expressed a positive attitude toward the country, while about 7.5% expressed a negative one. At the same time, compared to the previous survey in March, the share of positive assessments has decreased slightly. This is evidenced by the results of the third wave of the Active Group and Experts Club survey, according to the Experts Club Information and Analytical Center.
According to the results of the August survey, 11.2% of Ukrainians have a completely positive attitude toward Turkey, and 41.1% have a mostly positive attitude. A neutral stance is held by 37.6% of respondents. 6.7% view the country mostly negatively, 0.8% view it entirely negatively, and another 2.7% were undecided.
The balance between positive and negative attitudes stands at approximately plus 44.9 percentage points and is the highest among the Middle Eastern countries included in the study. Thus, despite a slight decline in the indicator, Turkey remains a country where positive assessments clearly outweigh negative ones.
Compared to March 2026, positive attitudes have weakened moderately. At that time, 14.5% of respondents viewed Turkey entirely positively, and 40.6% viewed it mostly positively—meaning the combined positive rating stood at 55%. Negative responses accounted for 5.6%, and neutral responses for 36.4%.
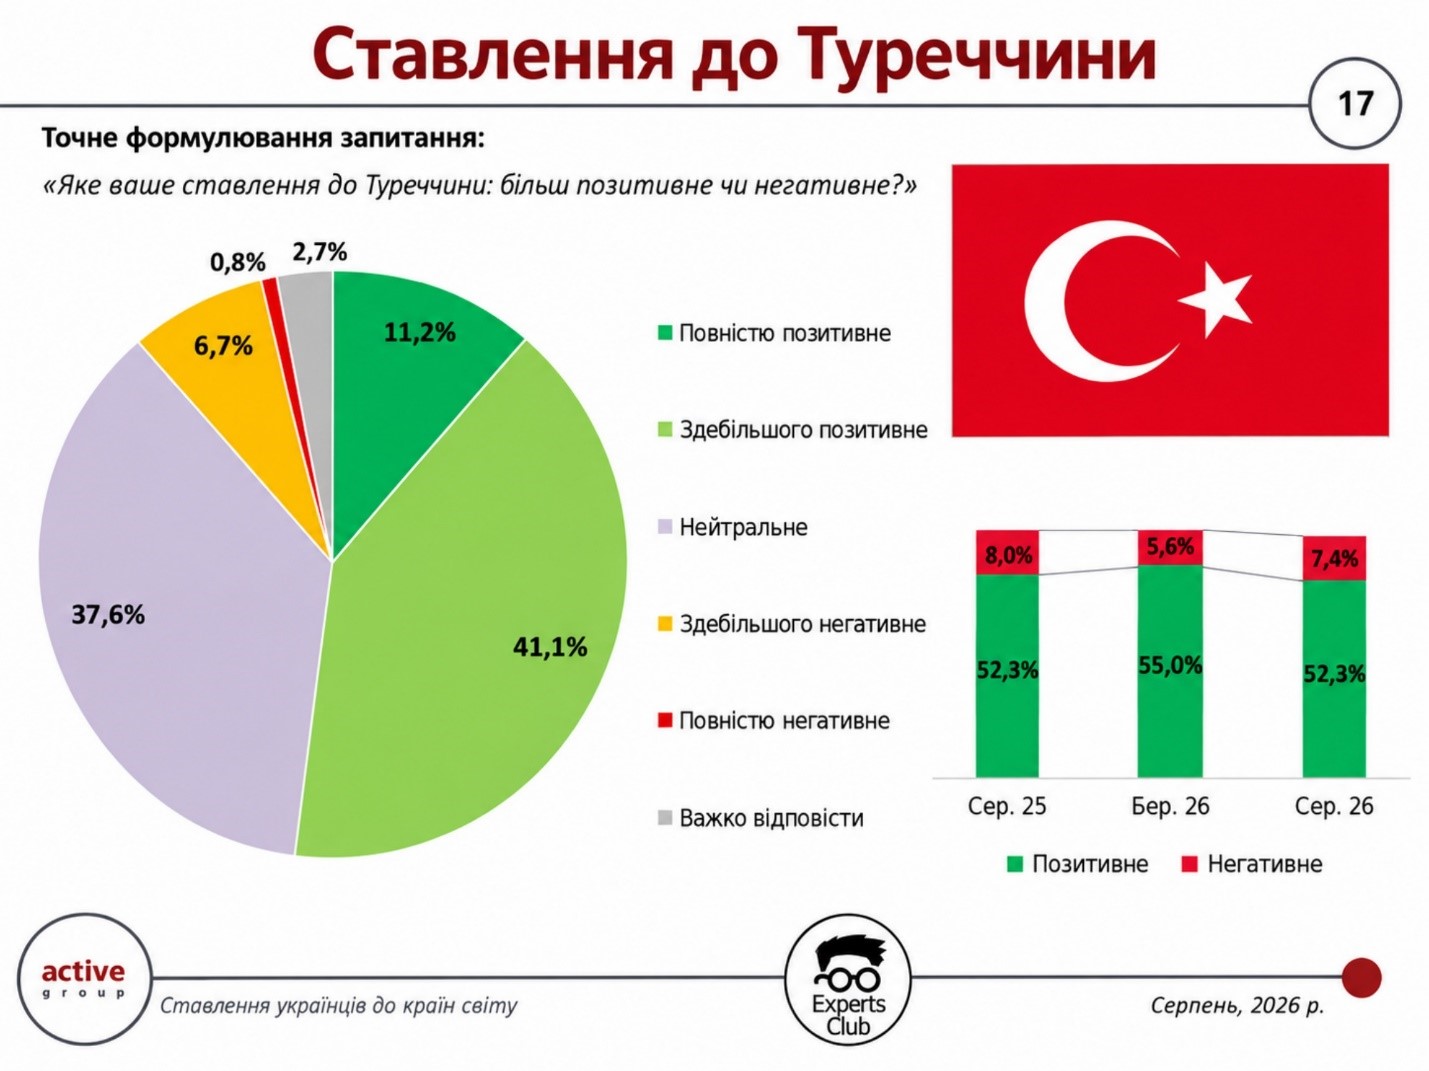
Thus, over the course of five months, the total share of positive assessments decreased by 2.7 percentage points—from 55% to 52.3%. Negative attitudes, on the other hand, increased by approximately 1.9 percentage points, while the share of neutral responses rose by 1.2 percentage points. The balance between positive and negative responses fell from 49.4 percentage points in March to about 44.9 percentage points in August. This indicates a moderate cooling of assessments rather than a fundamental shift in attitude.
Turkey remains one of Ukraine’s largest trading partners. In the first half of 2026, bilateral trade volume approached $4.9 billion: Ukrainian exports totaled about $1.78 billion, while imports amounted to $3.12 billion. Turkey was the second-largest single market for Ukrainian goods after Poland, and Ukraine’s bilateral trade deficit stood at about $1.34 billion.
Maksym Urakin, Ph.D. in Economics and founder of the Experts Club information and analytical center, commenting on the relationship between the economy and public perception of trading partners, noted:
“If society sees a massive flow of imports coming into the country but does not see a corresponding flow of investment, technology, or localized production, a sense of imbalance arises. And this directly affects the emotional perception of the partner. That is precisely why countries with a large trade surplus with Ukraine should pay particular attention to the reputational aspect of their presence in the Ukrainian market,” Urakin noted.
In the case of Turkey, the survey results show that a significant trade imbalance is currently combined with a predominantly positive public perception. At the same time, trends between March and August indicate a gradual decline in the predominance of positive assessments.
The survey, conducted in August 2026, used self-administered online questionnaires from the SunFlowerSociology panel among 800 Ukrainian citizens aged 18 and older. The sample is representative by age, gender, and region; the maximum theoretical margin of error is ±3.5 percentage points.
ACTIVE GROUP, EXPERTS CLUB, FOREIGN TRADE, international relations, PUBLIC OPINION, SOCIOLOGY, TURKEY, UKRAINE, URAKIN
According to Experts Club, China ranked last among Ukraine’s 50 largest trading partners in terms of the balance of positive and negative attitudes among Ukrainians—in August 2026, the figure stood at minus 25.4 percentage points. The next lowest results were recorded for India and Hungary—minus 14.3 and minus 12.7 percentage points, respectively. This is evidenced by the results of the third wave of the study “Ukrainians’ Attitudes Toward Countries Around the World,” conducted by Active Group in collaboration with Experts Club, reports the Experts Club Information and Analytical Center.
The balance was defined as the difference between the shares of positive and negative assessments. Regarding China, 18.2% of respondents expressed a positive attitude, 43.6% a negative one, and another 33.9% a neutral one. Thus, China received the lowest score among all countries surveyed, despite the fact that in the first half of 2026, China was Ukraine’s largest trading partner with a trade volume of approximately $14.68 billion.
The top ten countries with the lowest scores also included Lebanon—minus 9.2 percentage points—and Poland—minus 2.3 percentage points. Serbia, Algeria, Libya, Vietnam, and Tunisia remained in the positive range, however, their scores were among the lowest among the countries surveyed: Serbia at plus 2.3 percentage points, Algeria at plus 2.2, Libya at plus 1.0, Vietnam at plus 9.4, and Tunisia at plus 11.0 percentage points.
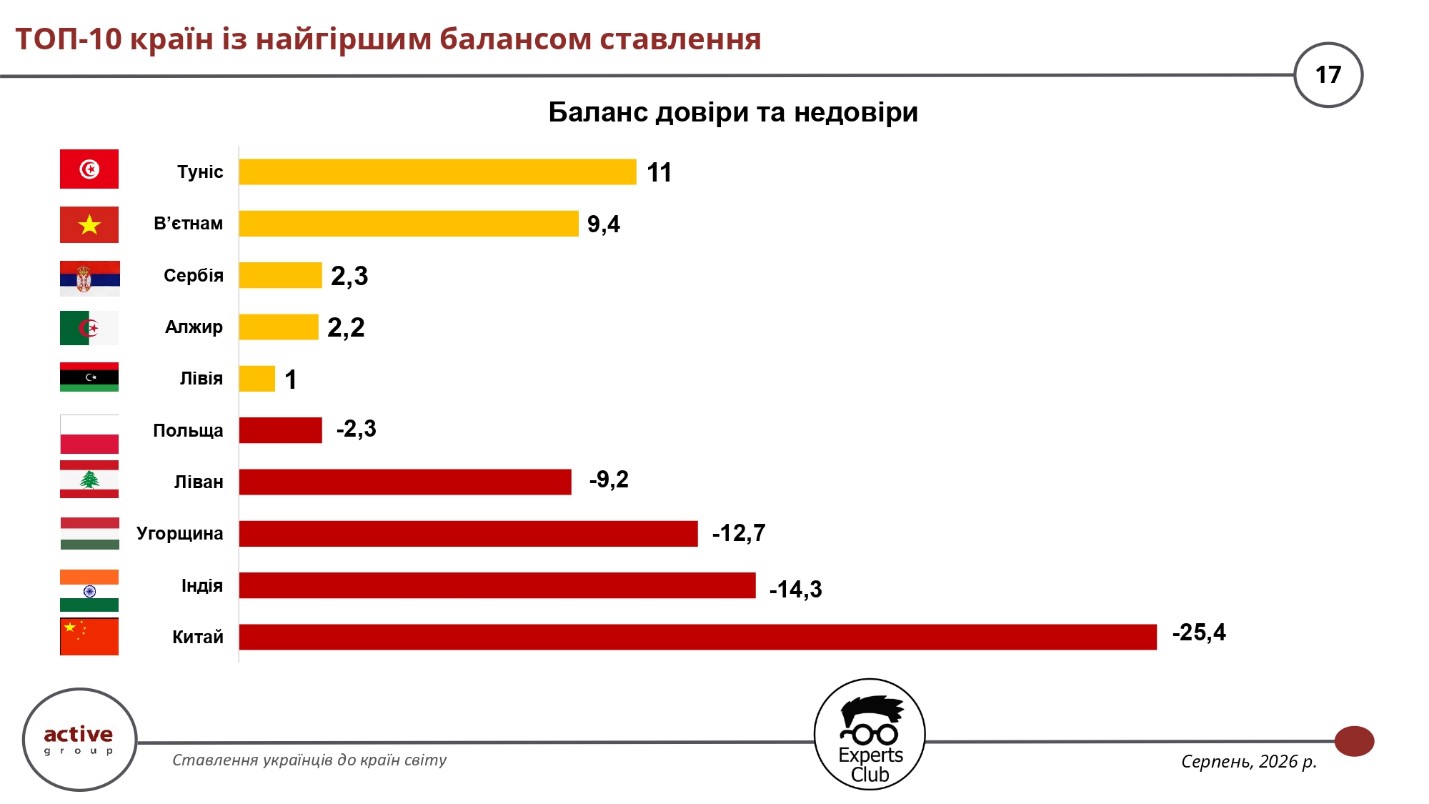
The shift in attitudes toward Poland was particularly noticeable. In March 2026, the balance of positive and negative assessments stood at +41.7 percentage points, whereas in August it fell to –2.3 percentage points. A positive attitude toward Poland was expressed by 34.6% of respondents, a negative one by 37%, and a neutral one by 25.4%. At the same time, Poland remains one of Ukraine’s largest trading partners and the largest market for Ukrainian goods exports among individual countries in the first half of 2026.
Maksym Urakin, founder of the Experts Club Information and Analytical Center, deputy director of the Interfax-Ukraine news agency, and candidate of economic sciences, noted that the results of the sociological survey should be analyzed in conjunction with actual trade figures.
“Second, we must be open to questions and inquiries from the media and the public. We also need to make use of our sociological research,” Urakin noted. In his view, systematic communication and the demonstration of concrete results of cooperation can help governments better explain the nature of bilateral relations to Ukrainian society.
Oleksandr Pozniy, director of the research company Active Group, highlighted the need to combine public awareness with the practical development of economic ties.
“We need to do more than just raise general awareness. We must expand cooperation with countries where we can achieve a positive trade balance,” Pozniy noted. He emphasized the role of business associations, economic institutions, and diplomatic missions in developing bilateral ties, especially with markets where Ukraine can increase its exports.
Overall, the survey results show that the scale of trade and economic ties does not always correspond to public attitudes toward the respective country. China stands out as the most striking example: it has the highest trade volume among individual partners, yet is simultaneously associated with the lowest ratings among Ukrainians.
The survey was conducted in August 2026 using self-administered online questionnaires in the SunFlowerSociology panel among 800 Ukrainian citizens aged 18 and older. The sample is representative by age, gender, and region; the maximum theoretical margin of error for indicators at the 50% confidence level is ±3.5 percentage points. This is the third wave of the study, following surveys conducted in August 2025 and March 2026.
ACTIVE GROUP, CHINA, EXPERTS CLUB, FOREIGN TRADE, HUNGARY, INDIA, international relations, POLAND, SOCIOLOGY, UKRAINE
European Union countries and the United Kingdom remain the top foreign economic priority for Ukrainians: in August 2026, 69.9% of respondents noted the need to prioritize the development of trade and economic relations with these countries. This is evidenced by the results of the third wave of the study “Ukrainians’ Attitudes Toward Countries Around the World,” conducted by Active Group in collaboration with the Experts Club Information and Analytical Center, according to the Experts Club Information and Analytical Center.
At the same time, support for the European direction has declined compared to previous waves of the study. In August 2025, 82.8% of respondents cited EU countries and the United Kingdom; in March 2026, 81.1%; and in August, 69.9%. Thus, over the course of a year, the figure decreased by 12.9 percentage points.
The trend regarding the United States is even more pronounced. In August 2025, 58.8% of respondents supported prioritizing the development of trade and economic relations with the United States; in March 2026, this figure was 59.2%, while in August it stood at 11.9%.
In August 2026, 8.4% of respondents named China as a priority, compared to 35.4% in March and 26.7% in August of the previous year. At the same time, China remains one of Ukraine’s most important trading partners, highlighting the discrepancy between the actual structure of foreign trade and public perceptions of the desired directions for its development.
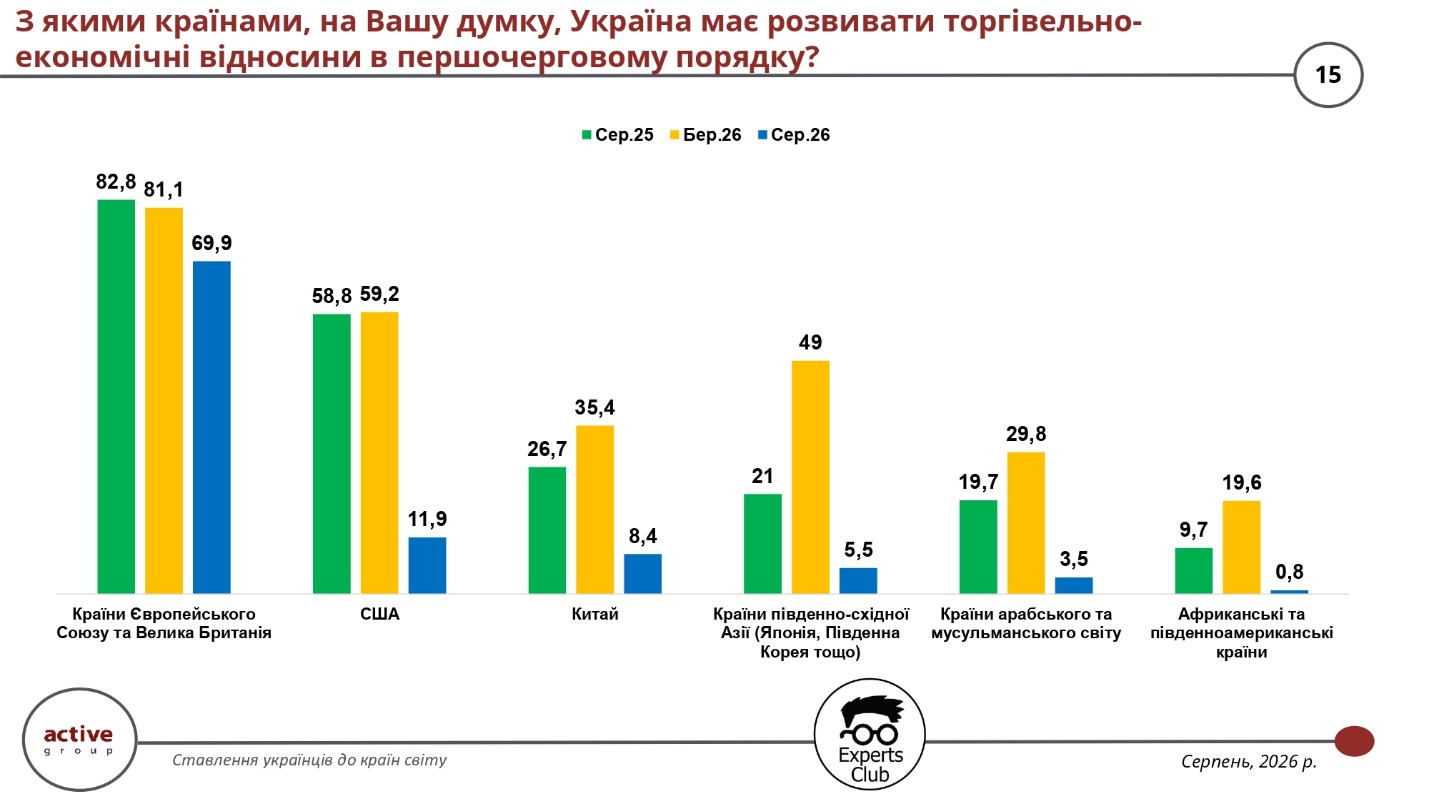
Another 5.5% of those surveyed in August advocated for prioritizing the deepening of economic relations with countries in Southeast Asia—Japan, South Korea, and other nations in the region. In March, this figure stood at 49%, and a year earlier—at 21%. Countries in the Arab and Muslim world were cited by 3.5% of respondents, compared to 29.8% in March, while African and South American countries were cited by 0.8%, compared to 19.6%.
Maksym Urakin, founder of the Experts Club information and analytical center, emphasized the need for more active communication between international partners and Ukrainian society.
“We need to regularly showcase concrete achievements and specific actions. Openness toward the media and the public helps strengthen relations, particularly trade relations,” Urakin noted.
According to him, sociological surveys can serve as a practical tool for government agencies, diplomatic missions, and the business community in determining the direction of bilateral relations.
Oleksandr Pozniy, director of the research firm Active Group, also highlighted the need to strengthen the economic component of international cooperation.
“We need to do more than just raise general awareness. Businesses and government agencies need to work more actively on developing bilateral relations,” Pozniy noted.
The survey was conducted in August 2026 using self-administered online questionnaires via the SunFlowerSociology panel. A total of 800 Ukrainian citizens aged 18 and older were surveyed. The sample is representative by age, gender, and region; the stated maximum theoretical margin of error is ±3.5 percentage points. Previous waves of the survey were conducted in August 2025 and March 2026.
ACTIVE GROUP, CHINA, EUROPEAN UNION, EXPERTS CLUB, FOREIGN TRADE, international relations, SOCIOLOGY, UKRAINE, UNITED KINGDOM, UNITED STATES
Ukraine’s foreign trade in goods in January–August 2026 was characterized by imports significantly exceeding exports and the concentration of the negative trade balance in relations with several of its largest partners. According to calculations based on the table “Ukraine’s Foreign Trade with Selected Countries” as of August 31, total trade turnover amounted to $92.95 billion, imports to $66.25 billion, and exports to $26.70 billion. The negative balance reached $39.55 billion, while imports exceeded exports by a factor of 2.48.
Exports covered only 40.3% of the value of imported goods. China was the largest individual trading partner and supplier, Poland was the main market for Ukrainian products, and the European Union as a whole accounted for 59.1% of Ukraine’s merchandise exports. Meanwhile, the largest positive trade balances were recorded in trade with Moldova, Spain, and Egypt.
“For every hundred dollars of merchandise imports, there were approximately forty dollars of merchandise exports. This ratio demonstrates the limited ability of the export sector to balance the economy’s demand for foreign products. Some imports support production and reconstruction, so they must be assessed with regard to the purpose of the goods. To improve the balance in the long term, the equipment purchased must help increase the output of competitive products in Ukraine,” said Maksym Urakin, PhD in Economics and founder of the Experts Club information and analytical center.
Ukraine recorded its largest trade turnover with China at $20.56 billion, or 22.1% of the total. Poland ranked second with $9.54 billion, followed by Germany with $6.10 billion. Ukraine had almost the same volume of trade with Turkey, at $6.08 billion, with the difference compared with Germany amounting to just $20.9 million. The United States completed the top five partners with $3.91 billion.

These five countries accounted for 49.7% of trade turnover, while the ten largest partners accounted for 63.4%. Thus, trade results with a relatively small group of countries largely determined Ukraine’s overall foreign trade balance.
Ukraine’s Ten Largest Trading Partners by Trade Turnover in January–August 2026, USD Billion
| Country | Imports | Exports | Balance | Trade Turnover |
|---|---|---|---|---|
| China | 19.639 | 0.924 | −18.715 | 20.563 |
| Poland | 6.277 | 3.261 | −3.016 | 9.538 |
| Germany | 4.377 | 1.726 | −2.651 | 6.104 |
| Turkey | 3.991 | 2.092 | −1.899 | 6.083 |
| United States | 3.210 | 0.700 | −2.510 | 3.910 |
| Italy | 1.834 | 1.519 | −0.315 | 3.353 |
| Netherlands | 1.151 | 1.311 | +0.160 | 2.462 |
| Hungary | 1.549 | 0.846 | −0.703 | 2.394 |
| Czech Republic | 1.670 | 0.705 | −0.965 | 2.375 |
| Slovakia | 1.343 | 0.792 | −0.551 | 2.135 |
Source: State Customs Service of Ukraine
The next largest partners included Romania, with trade turnover of $2.05 billion, Spain with $1.98 billion, Lithuania with $1.80 billion, France with $1.77 billion, and Greece with $1.52 billion. Total trade turnover with the 27 EU member states amounted to $43.60 billion, or 46.9% of the overall figure. Ukrainian exports to the EU totaled $15.78 billion, imports reached $27.81 billion, and the deficit amounted to $12.03 billion.
The EU’s high share of exports means that access to the European market is of decisive importance for Ukrainian producers. At the same time, substantial purchases from EU countries constitute a separate source of the trade deficit. The situation within this trade relationship is uneven: the largest gaps are recorded with Poland and Germany, while Ukraine has positive trade balances with Spain and the Netherlands.
China supplied $19.64 billion worth of imports, or 29.6% of total merchandise imports. Supplies from Poland amounted to $6.28 billion, or 9.5%, while those from Germany reached $4.38 billion, or 6.6%. Together, these three countries accounted for 45.7% of Ukraine’s merchandise imports.
The five largest suppliers also included Turkey with $3.99 billion and the United States with $3.21 billion. The combined share of the top five reached 56.6%, while the ten largest suppliers accounted for 68.3%. Other major sources of imports included Italy with $1.83 billion, the Czech Republic with $1.67 billion, Hungary with $1.55 billion, and Slovakia and Lithuania with approximately $1.34 billion each.

The State Customs Service provides a breakdown of the overall commodity structure for the same period. In January–August 2026, Ukraine imported machinery, equipment, and transport vehicles worth more than $29.9 billion, fuel and energy products worth more than $9.5 billion, and chemical industry products worth more than $9 billion. These categories accounted for more than 73% of imports; machinery, equipment, and transport represented approximately 45%.
This ratio indicates the significant role of industrial and energy products in imports. However, the broad category of machinery and transport includes goods intended for different purposes. Its entire value cannot be interpreted as investment in production: doing so would require separate analysis of industrial equipment, components, vehicles, and final consumer goods.
“The concentration of almost one-third of imports with a single supplier makes Ukrainian businesses sensitive to supply conditions from China. Logistics disruptions or changes in component prices may affect many enterprises simultaneously. At the same time, reducing purchases without affordable alternatives could constrain Ukrainian production itself. The practical task is to diversify suppliers and develop domestic production of goods for which Ukraine has the economic and technological prerequisites,” Urakin commented.
Poland remained the largest export market, receiving goods worth $3.26 billion, or 12.2% of Ukraine’s total exports. Turkey ranked second with $2.09 billion and a share of 7.8%, followed by Germany with $1.73 billion and 6.5%. Italy followed with $1.52 billion, the Netherlands with $1.31 billion, and Spain with $1.29 billion.
Exports to China amounted to $924.2 million, Romania to $878.0 million, Hungary to $845.6 million, and Slovakia to $792.4 million. Egypt and Moldova purchased Ukrainian goods worth $751.0 million and $750.5 million, respectively. Supplies to the Czech Republic amounted to $705.2 million, while exports to the United States reached $700.0 million.

Exports were less concentrated among individual countries than imports: the three largest markets accounted for 26.5% of shipments, the top five for 37.1%, and the top ten for 54.8%. At the same time, the EU’s dominance as a combined market means that the diversity of destination countries only partially reduces dependence on the economic and regulatory conditions they share.
According to the State Customs Service, food exports exceeded $15.4 billion over the eight months, exports of metals and metal products approached $2.7 billion, and exports of machinery, equipment, and transport approached $2.4 billion. The approximate shares of these groups in total exports were 58%, 10%, and 9%, respectively. Food products remained the main source of merchandise export revenue. [2]
“The geography of exports allows Ukraine to operate in different markets, but the commodity structure remains heavily dependent on food products. For such shipments, harvest volumes, global prices, and transportation costs are particularly important. The development of processing can increase revenue per unit of raw material, although it requires investment and a stable energy supply. At the same time, industrial exports must be expanded so that the performance of several agricultural commodity groups has less influence on the overall picture,” Maksym Urakin noted.
The largest bilateral deficit was recorded in trade with China at $18.71 billion. This was equivalent to 47.3% of Ukraine’s net merchandise trade deficit. Exports to China covered only 4.7% of imports from that country, while Chinese goods accounted for 95.5% of bilateral trade turnover.
The second-largest deficit was recorded with Poland at $3.02 billion. Germany followed with $2.65 billion, the United States with $2.51 billion, and Turkey with $1.90 billion. Together, the negative trade balance with these five countries amounted to $28.79 billion.
Significant deficits were also recorded in trade with Greece at $1.07 billion, the Czech Republic at $964.7 million, Lithuania at $864.6 million, France at $864.5 million, and Taiwan at $844.5 million. Thus, the imbalance extended far beyond relations with the single largest supplier.
The sum of negative trade balances across all deficit-producing trade relationships reached $43.90 billion. Positive balances totaling $4.35 billion in other rows of the table reduced this amount to an overall deficit of $39.55 billion. Accordingly, China accounted for 42.6% of the sum of bilateral deficits, while the five largest deficit-producing trade relationships accounted for 65.6%. This provides a more accurate picture of their concentration than comparing them solely with the net result after surpluses are taken into account.
“The deficit with China exceeds the combined negative trade balance with all EU countries. This illustrates how unevenly Ukraine’s dependence on imports is distributed. At the same time, a bilateral deficit in itself does not determine whether trade with a particular country is economically beneficial. It is necessary to assess how imported goods are used domestically and what contribution they make to employment, production, and future exports,” Urakin emphasized.
Ukraine recorded its largest positive trade balance with Moldova at $640.6 million. With exports of $750.5 million, imports from that country amounted to $109.9 million, meaning that Ukrainian supplies exceeded imports by almost 6.8 times. Spain ranked second in terms of the surplus, at $613.0 million: exports to Spain reached $1.29 billion, while imports amounted to $681.8 million.
The third-largest surplus was recorded with Egypt at $493.5 million. Algeria followed with $361.0 million, Lebanon with $258.7 million, and Libya with $219.8 million. The positive balance with Iraq amounted to $169.1 million, the Netherlands to $160.1 million, Tunisia to $157.0 million, and Yemen to $134.0 million.
The five largest surpluses – with Moldova, Spain, Egypt, Algeria, and Lebanon – totaled $2.37 billion, or 54.4% of all positive balances. However, surplus-generating trade relationships offset only 9.9% of the sum of bilateral deficits overall. Even successful export markets had not yet generated sufficient revenue to balance purchases from the largest suppliers.
“Moldova, Spain, and Egypt demonstrate that Ukraine has markets where its own supplies significantly exceed imports. These should be considered a basis for expanding product ranges and strengthening long-term relationships with buyers. However, a large surplus in an individual trade relationship does not necessarily mean it can be increased rapidly without demand constraints. To have a tangible impact on the overall balance, exports must increase simultaneously across many markets,” Maksym Urakin believes.
A detailed breakdown by commodity helps explain differences between trade relationships. Below, figures for January–August 2026 are supplemented with reference data for 2025 and other explicitly specified periods. Historical shares describe their respective periods and cannot automatically be applied to the first eight months of 2026.
According to GMK Center calculations based on State Customs Service data, Ukraine supplied 7 million tonnes of iron ore to China in January–August 2026, 38% less than a year earlier. This represented approximately 44% of Ukraine’s total iron ore exports by physical volume during the period, which amounted to 15.8 million tonnes. The Chinese market thus remained extremely important for the mining industry, although Ukraine’s total exports to China were much smaller than imports.
For its part, the National Institute for Strategic Studies noted in its review of 2025 that machinery, equipment, and transport accounted for 69.8% of Ukrainian imports from China. Comparing these data from different periods highlights the differences in the commodity profiles of bilateral trade: the major role of manufactured products in Chinese supplies is combined with the importance of raw materials in Ukrainian exports. The precise structure of this exchange during the first eight months of 2026 can only be determined through a complete breakdown of commodity categories.
In January–August 2026, Ukraine shipped 2.1 million tonnes of iron ore to Poland. For comparison, Slovakia received 2.9 million tonnes over the same period. These figures illustrate the role of both markets in sales of products from Ukraine’s mining industry.
A broader Polish commodity profile is contained in the Polish Ministry of Development and Technology’s response to parliamentary inquiry No. 17426, reproduced in the Politoskop database. According to the GUS data for 2025 cited there, major supplies from Ukraine to Poland included soybean oil worth €399.7 million, iron ores and concentrates worth €342.3 million, and rolled ferrous metal products worth €315.5 million. In the opposite direction, substantial volumes consisted of petroleum products worth €1.76 billion, unmanned aerial vehicles worth €759.6 million, and passenger cars worth €555.8 million. These figures come from Polish statistics for the full year 2025 and therefore serve as a separate description of the commodity composition of trade.
According to preliminary German official agricultural statistics for 2025, industrial goods accounted for approximately 94% of German supplies to Ukraine. Meanwhile, Germany imported agricultural and food products from Ukraine worth approximately €1.3 billion and industrial sector goods worth €1.8 billion. Agricultural supplies notably included oilseeds, primarily rapeseed, as well as vegetable oils worth €172 million and processed fruit products and preserved fruit worth €101 million. This structure indicates that Ukrainian exports to Germany also include a substantial industrial component.
According to the analysis by the National Institute for Strategic Studies, corn was an important item in Ukrainian exports to Turkey in 2025, with shipments worth approximately $1.2 billion. Among imports from Turkey, petroleum products accounted for $639 million, while the aggregated category of “other goods” amounted to $2.1 billion. Without further detail, it would be incorrect to associate the latter with any specific industry. Data for January–August 2026 also confirm the presence of metallurgical trade: according to GMK Center calculations, Ukraine exported 83,200 tonnes of pig iron to Turkey.
In January–August 2026, the United States purchased 900,600 tonnes of Ukrainian pig iron, while total exports of this product amounted to approximately 1.03 million tonnes. Thus, the US market accounted for approximately 87% of shipments by physical volume. Italy received 26,500 tonnes during the same period. Sales of an individual commodity may be much more concentrated in one market than Ukraine’s total exports across countries.
Data from the Verkhovna Rada Committee on Agrarian and Land Policy, citing the State Customs Service, demonstrate the importance of the Spanish, Italian, and Indian markets for the vegetable oil industry. In the first half of 2025, Spain purchased Ukrainian sunflower oil worth $356.9 million, Italy purchased $337.5 million, and India purchased $326.1 million. Their shares in the value of exports of this product were 12.88%, 12.18%, and 11.77%, respectively. This is an example of the specialization of individual markets in sales of Ukrainian processed agricultural products, not an estimate of their shares for January–August 2026.
The geographic and commodity data indicate a combination of high demand for imported industrial products with exports dominated by food products, while ore and metallurgical products play a substantial role in certain trade relationships. Given this structure, opportunities to improve the balance depend on production capacity, energy supply, accessible logistics, and conditions for entering foreign markets.
At the same time, the merchandise trade deficit is not equivalent to a deficit in the overall balance of payments or an automatic reduction in foreign exchange reserves by the same amount. External financing is also influenced by trade in services, income, transfers, and financial transactions. Therefore, the figure of $39.55 billion specifically characterizes the gap between merchandise exports and imports within the statistics presented.
“Improving the trade balance requires expanding the capacity of Ukrainian enterprises to produce goods and sell them abroad. Equipment purchases can contribute to this if they are accompanied by investment in production, access to energy, and clear operating conditions. Stable transportation and the ability to fulfill contracts without forced interruptions are equally important for exporters. It is the growth of competitive domestic production that can gradually narrow the gap between imports and exports,” Maksym Urakin concluded.
ECONOMY, EXPERTS CLUB, EXPORTS, FOREIGN TRADE, IMPORTS, TRADE DEFICIT, UKRAINE