Ukraine is entering the autumn-winter season with a sufficient amount of gas in underground storage facilities, while maintaining a stable pricing policy, said Oleksiy Chernyshov, CEO of Naftogaz of Ukraine, during the United News telethon.
“Gas prices for households and district heating companies remain stable. They will not change until the end of winter. Therefore, I have to reassure the population in this regard, as well as cities and district heating companies,” he emphasized.
The Head of Naftogaz Group also noted that the preparations for the heating season were at the proper level.
“We have to move forward, get through this winter and be absolutely confident of victory and further actions,” Chernyshov said.
Earlier on Tuesday, Energy Minister Herman Halushchenko said that electricity prices for household consumers would remain stable until the end of this heating season.
“As for resources, we will be provided with everything we need, both coal and gas. Due to high temperatures in the last two months of summer, coal stocks in warehouses have fallen slightly, but we have already signed relevant contracts, including imports, and we will be fully provided with coal in the required volume,” the minister said.
According to him, almost 15 billion cubic meters of gas have been accumulated in storage facilities so far, which is even more than planned for the beginning of the heating season.
Changes in revenue of the consolidated budget in 2021-2023 (%)
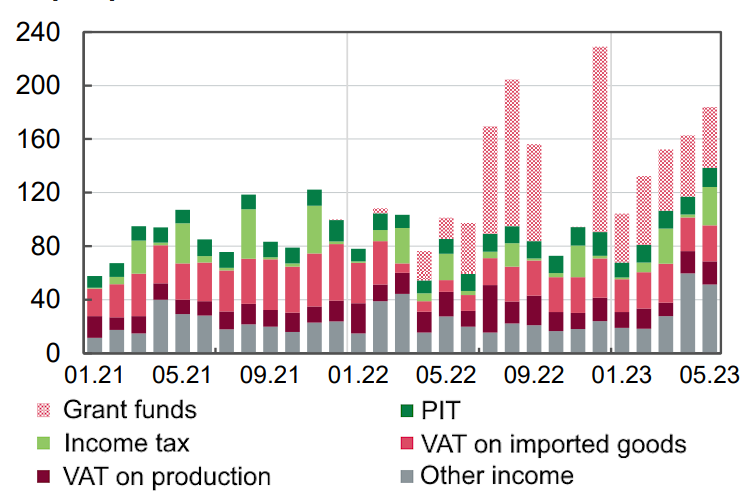
Source: Open4Business.com.ua and experts.news

Polish President Andrzej Duda has said that Prime Minister Mateusz Marowiecki’s words that Warsaw is “no longer transferring weapons to Ukraine” were taken out of context, TVN24 reported on Thursday.
“In my opinion, the prime minister simply said this: we are not going to transfer to Ukraine the new weapons that we are now buying as part of the modernization of the Polish army,” the Polish president explained.
According to Duda, “We both had the same position. We cannot hand over to someone else our new weapons, which we are now buying for billions of dollars for the Polish army to strengthen it, to strengthen Poland’s security. To anyone.”
Duda specified that those contracts on Polish arms, which Poland signed with Ukraine, will be fulfilled.
At the same time, he recalled that contracts with Ukraine have been signed, including for the delivery of Polish self-propelled howitzers Krab. “We need to fulfill this contract, and we are fulfilling it,” Duda said, adding that there are other contracts concerning ammunition and demining equipment.
“As we receive new armaments from Korea, from the United States, we will also replace the armaments that are now in storage,” Duda said, noting that such armaments could be sent to Ukraine “as we did before, transferring post-Soviet armaments.”

The United States will provide Ukraine with new security assistance worth $128 million, as well as $197 million in weapons and equipment as part of a previously authorized reduction, US Secretary of State Anthony Blinken said.
The package contains additional air defense munitions “to help strengthen Ukraine’s air defenses against Russian air attacks now and in the coming winter, when Russia is likely to resume its attacks on Ukraine’s critical infrastructure,” Blinken said on Thursday, CNN reports.
“It also contains artillery munitions and anti-tank weapons, as well as cluster munitions that will further enhance Ukraine’s ability to continue its counteroffensive against Russian forces,” he added.
This statement was made during a meeting between President of Ukraine Volodymyr Zelenskyy and President Joe Biden in Washington, DC.

Kormotech, Ukraine’s largest producer of cat and dog food, is setting up a venture capital fund that will invest in the development of petcare and petfood startups, the company’s press service told Interfax-Ukraine.
The UK-based Kormotech Ventures division will search for relevant startups and invest in innovative areas of the company’s development in international markets.
“We were once innovators when we were the first to produce cat and dog food in Ukraine. It is important for us to maintain these fundamental things – flexibility and openness to new knowledge. We want to preserve and multiply the bold entrepreneurial spirit with which we created Kormotech 20 years ago, and with which we became leaders in Ukraine and became one of the top suppliers in strategic export markets,” said Rostyslav Vovk, CEO and co-owner of Kormotech.
Kormotech Ventures will focus on finding innovative startups that are looking for seed investments in the pet care industry in Europe and the US. The company will also fully manage investment projects as a majority shareholder.
It is specified that the core of Kormotech’s business will remain unchanged – the development of high-quality pet food production and expansion of its presence in the pet food markets in Central and Eastern Europe.
The first investment of Kormotech Ventures was the acquisition of a controlling stake in Rocketo, a Lithuanian startup producing organic dog food by gentle drying at low temperatures.
Rocketo is scaling up its presence in the UK market by developing a multi-channel distribution system. In particular, in addition to direct sales through its own online store, Rocketo has been included in the Future Brands program of the Sainsbury’s retail chain and will present its organic dog treats.
“As a family business, we strive to increase the value of our partners’ products and share our experience in organizing business processes, as well as the potential of our best specialists, which will be involved in the structure of Kormotech Ventures,” added Vovk.
Kormotech LLC is a leading Ukrainian manufacturer of pet food for cats and dogs, ranked 51st in the global pet food ranking and 7th in the ranking of the fastest growing pet food brands. Kormotech sells products of its own and partner brands in 40 countries.
The company’s facilities include two dry and wet food production plants in Lviv region and a plant in Lithuania. The company produces products for cats and dogs under its own brands Optimeal, CLUB 4 PAWS (TM “Meow!” and “Woof!”) and private label. The product range includes more than 650 items.
In 2022, Kormotech’s turnover increased by 12% to $124 million from $110 million in 2021. The goal for 2023 is to reach a turnover of $150 million and increase the export/Ukraine ratio to 30%/70% from 24%/76% previously due to the synchronized growth of markets, the statement said.
The ultimate beneficiaries of Kormotech are Olena and Rostyslav Vovk.
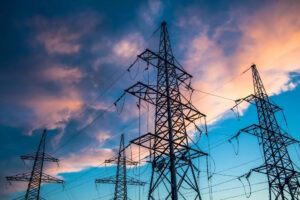
In the run-up to the winter period of 2023/2024, Ukraine’s energy system faces a number of key challenges and issues. In the context of ongoing military operations and possible shelling of energy infrastructure, the ever-changing situation in the global energy market, geopolitical features and climate change, the analysis of factors affecting the sustainability and efficiency of the industry is of particular importance. The comfort and safety of millions of Ukrainians during the cold season depends on how well and timely the peculiarities of thermal and nuclear generation, renewable energy sources and the state of the oil and gas industry are taken into account. Our review is aimed at assessing the country’s current readiness for the upcoming winter season, identifying potential weaknesses and suggesting the best ways to address them. The Club of Experts has analyzed the main factors that may affect the stability of Ukraine’s power system in the autumn and winter.
Thermal generation
The current situation with Ukraine’s thermal generation seems to be quite problematic, especially in terms of preparations for the winter period:
Repair works and the degree of recovery.
The Prime Minister of Ukraine Denys Shmyhal confirmed that the energy sector is actively continuing to prepare for winter, and in the midst of summer. Twenty-four power units of thermal power plants have been repaired or are under repair, which is 62% of the total. In addition, 70% of CHPPs have been repaired, and the remaining 30% are in the process of repair.
Also, according to the Prime Minister, Ukrenergo has already completed almost 80% of the repair of trunk power grids, and high-voltage substations have been restored to the pre-war level. In addition, a multi-level defense for energy facilities is being actively developed.
At the same time, the NEURC Chairman emphasized the need to accelerate the provision of additional financial resources. Under the government’s 5-7-9 soft loan program, UAH 7.6 billion can be allocated for CHPs and TPPs.
In total, the damage to TPP and CHPP equipment is estimated at UAH 29.9 billion, while only UAH 482 million was spent on emergency repair work. NPC Ukrenergo suffered losses of UAH 9.6 billion, but the cost of restoration amounted to only UAH 681 million.

Impact of electricity deficit on real GDP compared to no deficit, % (forecast until 2024, data from the National Bank of Ukraine)
The problem of coal supply
As of August 4, TPPs and CHPPs had accumulated 1.4 million tons of thermal coal in their warehouses, which is 100 thousand tons less than the approved plan. This gap is due to the active operation of thermal generation in July to cover the electricity shortage, which led to additional coal consumption.
The lag in coal production at state-owned mines is 148 thousand tons, or 10-15% compared to last year. This is due to the fact that 10 state-owned mines are under occupation, which negatively affects the total production.
To save coal, companies are considering using fuel oil. Several thermal power plants are currently actively using fuel oil, some at 100% and others at a ratio of 60% fuel oil to 40% gas.
Self-sufficiency of the population
Volodymyr Kudrytskyi, Chairman of the Board of the transmission system operator NPC Ukrenergo, called on the population of Ukraine to prepare or purchase electricity generators as a preventive measure against possible blackouts or power outages in the winter.
Kudrytsky emphasized that it is impossible to accurately predict the probability of blackouts, as it depends on the nature and success of Russian attacks.

Imports of equipment to ensure energy autonomy in 2021-2023, USD million (data from the National Bank of Ukraine)
According to industry representatives, special attention should be paid to the need for rational use of electricity, especially during peak hours. Citizens are urged to become more economical and responsible consumers of electricity.
Overall reduction in capacity
According to a report prepared by the UNDP and the World Bank, the available capacity to generate electricity in Ukraine has halved since the start of the Russian invasion in February 2022. The biggest hit has been to maneuvering capacity, especially at thermal power plants, making the system more vulnerable to rapid changes in demand.
Drop in capacity of different types of generation: Nuclear generation capacity decreased by 44%, hydropower by 29%, and renewable energy sources (RES) by 24%.

Distribution of electricity generation sources in Ukraine in 2000-2020 (data from ENTSO-E)
International support
On June 20, 2023, the transmission system operators of Continental Europe decided to increase the maximum capacity for electricity imports to Ukraine and Moldova to 1200 MW, an increase of 150 MW compared to the previous values.
Since June 2022, the TSOs of Continental Europe have continued to regularly adjust import limits, taking into account the needs of Ukraine and Moldova, as well as the results of measures to ensure the stability and security of the power system.
The European Network of Transmission System Operators for Electricity, ENTSO-E, plays a key role in coordinating the work of European transmission system operators, representing the interests of 39 TSOs from 35 countries. This organization ensures the coordinated and secure operation of the European power system, the largest interconnected power grid in the world, and acts as a platform for technical cooperation between countries.

Cross-border power lines in the western part of Ukraine and their capacity (data – ENTSO-E)
On August 25, the National Energy and Utilities Regulatory Commission (NEURC) approved the rules for allocating the capacity of the Ukraine-Romania cross-border transmission lines, as well as the structure for allocating the capacity of the Ukraine-Poland and Ukraine-Romania cross-border transmission lines.
As follows from the adopted resolutions of the National Commission, the structure of capacity allocation for auctions in the direction of Rzeszów – Khmelnytska NPP line of the Ukraine-Poland interstate section was approved by the regulator in the amount of 0% for annual and monthly auctions, and 100% for daily auctions.
This will help to increase the degree of synchronization of the power systems of Ukraine and the EU countries ahead of the winter period.
Conclusions to the section: Thus, the thermal segment of Ukraine’s energy system faces a number of challenges due to the war and the loss of some of its resources. However, thanks to internal measures and active support from European partners, the country is doing everything possible to ensure stable and secure energy supply to its citizens on the eve of the winter season.
Nuclear generation
Overview of repair work.
According to Petro Kotin, President of NNEGC Energoatom, four out of nine power units at nuclear power plants (NPPs) have to be repaired before the start of the autumn-winter period. Five units have already been repaired and successfully commissioned. One more unit is expected to complete repairs by the end of August, and the remaining three will be commissioned within the next two months.
According to Kotin, there are currently no units awaiting the start of repair work. All units have either been repaired or are in the process of being repaired. In addition, he confirmed that the company’s financial and economic program for the repair of the units is in full order and fully balanced.
Confirming the information provided by Energy Minister Herman Halushchenko, Kotin assured that all nine power units of South Ukrainian, Rivne and Khmelnytsky NPPs with a total capacity of 7,880 MW will be loaded at full capacity in the winter period from November 2023 to February 2024.
As of the end of August 2023, Ukraine has three NPPs in operation – Khmelnytska, Rivnenska and South Ukrainian NPPs with a total number of 9 units and a total capacity of 7.8 GW. Zaporizhzhia NPP with a capacity of 6 GW was seized by Russia on March 4, 2022, and has not been generating electricity for almost a year.
International cooperation
Ukraine and Canada intend to cooperate in the field of pre-licensing safety assessment of small modular reactors (SMRs). This initiative was announced after the signing of a memorandum of understanding between Oleh Korikov, Chairman of the SNRIU, and Rumina Welsh, President of the Canadian Nuclear Safety Commission.
Canada is one of the world leaders in nuclear energy, actively working to introduce new technologies. This is especially relevant in light of the need to replace old facilities that were launched in 1970-1980 and are reaching the end of their service life.
Given the difficult situation around the temporarily occupied Zaporizhzhia NPP and other nuclear facilities affected by the war, Ukrainian and Canadian regulators will cooperate in ensuring their safe operation. Both sides also expressed interest in improving regulatory activities in the field of radioactive waste management.
Conclusion on the section: The nuclear power industry of Ukraine is in an active stage of preparation for the upcoming winter period. Taking into account active repair works and Energoatom’s balanced economic strategy, the Ukrainian nuclear power system demonstrates readiness for efficient and safe operation in the cold season.
Development of renewable energy
Problems with water storage at Ukrhydroenergo
“Ukrhydroenergo, a key hydropower producer in Ukraine, is facing a shortage of water needed to maintain electricity production at the usual level. This is due to an increased production load and the company’s inability to accumulate sufficient water before the start of the heating season.
According to Bohdan Sukhetskyi, Deputy CEO for Commercial Activities, water is analogous to fuel for Ukrhydroenergo. In the past, the company has accumulated sufficient water reserves to help the power system at the initial stage of the autumn-winter period.
Under current conditions, Ukrhydroenergo is forced to work at the limit of its capabilities. Mr. Sukhetsky pointed out that NPC Ukrenergo uses 20-40% more electricity generation schedule than Ukrhydroenergo provides, which leads to additional water consumption.
Particular attention was paid to the impact on the operation of the Dnipro cascade hydroelectric power plants after the Kakhovka HPP was blown up. The situation with the Kakhovka reservoir has led to an imbalance in the cascade system, starting from the Kyiv reservoir and down to the lower part of the Dnipro.
“Ukrhydroenergo is facing a serious challenge related to the lack of water resources to maintain efficient operations. This could affect the stability of the country’s energy supply, especially in the run-up to the fall and winter. Given the difficult political and military situation, as well as the consequences of the Kakhovka hydroelectric power plant explosion, the importance of solving this problem cannot be underestimated.
Green energy
DTEK plans to complete the construction of wind farms with a total capacity of 600-700 MW by the end of 2024. By 2030, DTEK expects to implement projects with a total capacity of at least 2 GW.
At the same time, a new energy strategy for Ukraine was presented at the URC2023 conference, which reflects ambitious plans for the development of various energy sectors in the country:
Wind generation: the goal is to reach a capacity of 140 GW with investments of $134 billion.
Solar power generation: it is planned to increase to 94 GW with funding of $62 billion.
Energy storage: aiming for 38 GW of capacity with a budget of $25 billion.
Nuclear generation: the goal is 30 GW, which requires $80 billion.
CHP and bioenergy: development of up to 18 GW (no data on financing).
Hydropower: plans for 9 GW of capacity with investments of $4.5 billion.
Additionally, it is planned to allocate $72 billion for the development of hydrogen technologies, $5 billion for energy transmission systems and another $4.5 billion for hydropower.
The total investment needs for Ukraine’s new energy capacities amount to an impressive $383 billion, according to Ukraine’s Energy Minister Herman Galushchenko.
Within the framework of URC2023, the Ukrainian Wind Energy Association (UWEA) also signed a memorandum of understanding with the UK’s largest renewable energy association, RenewableUK. This step is aimed at strengthening cooperation, sharing experience and knowledge, as well as stimulating trade and market development between the renewable energy sectors of both countries.
These measures and plans demonstrate that Ukraine is focusing on the diversification and sustainable development of its energy sector, relying on modern technologies and international cooperation.
On July 3, the Verkhovna Rada of Ukraine passed a key bill that could dramatically change the country’s green energy landscape. Here are the main points of this draft law:
Energy resources
Gas storage facilities
By the beginning of the autumn-winter period, Ukraine plans to accumulate 14.7 billion cubic meters of gas in its storage facilities. Currently, 11.7 billion cubic meters have already been accumulated. The key issues now are the repair and safety of thermal energy facilities and the accumulation of fuel resources. The Cabinet of Ministers emphasized the importance of being prepared for the heating season and preparing for possible attacks on thermal energy infrastructure.
Fuel market
The A-95 Consulting Group provided data according to which the price of gasoline in August-September may reach 60.86 UAH/l, diesel fuel – 55.61 UAH/l, and gas – 26.63 UAH/l. The main factors affecting price changes are the integration of higher taxes and rising global prices, as well as the sale of fuel stocks formed before the abolition of preferential taxes.
Sergiy Kuyun, Group Director of A-95, noted the key influence of major players such as OKKO, WOG and Ukrnafta on price stabilization. He also pointed to supply difficulties due to the Russian shelling of Ukrainian ports, which led to an increase in freight and insurance requirements. In this regard, Kuyun suggested increasing onshore contracts and consolidating traders to conclude long-term contracts for large tanker shipments.

Dynamics of changes in fuel prices in 2022-2023, UAH/liter (data from the National Bank)
Overall, the industry is facing a number of challenges, including the need to increase gas reserves, a difficult situation in the fuel market due to changes in pricing, and risks associated with the political situation. Strategic decisions at the state level are needed to stabilize the situation.
General conclusions
Ahead of the autumn-winter season of 2023/2024, Ukraine’s power system is generally ready to provide stable electricity supply to consumers. Given the low intensity or absence of missile attacks on energy facilities, rolling blackouts may be sporadic or not applied at all. The probability of blackout in this scenario remains minimal.
In the event of new attacks on the power system in the autumn and winter, the probability of blackouts increases, while the number and duration of blackouts will depend on the nature and success of attacks by the Russian Federation. At the same time, given the energy sector’s preparations for such a scenario, possible blackouts will be temporary.
The co-authors of this analytical review are Maksym Urakin, co-founder of Experts Club, PhD in Economics, and Oleksiy Fedinsky, Director of the analytical center.