
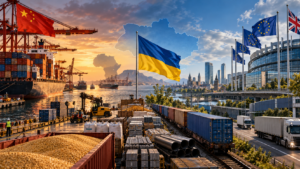
China retained first place among Ukraine’s trading partners in January–June 2026, with total trade turnover of $14.68 billion, more than twice Poland’s figure ($7.05 billion), according to a foreign trade analysis presented by Maksym Urakin, founder of the Experts Club analytical center, in a video review of Ukraine’s foreign trade on the YouTube channel of the Experts Club information and analytical center.
The next positions in terms of bilateral trade volume were occupied by Turkey – $4.90 billion, Germany – $4.48 billion, and the United States – $3.07 billion. Italy, Hungary, the Netherlands, the Czech Republic, and Slovakia also entered the top ten.
As Urakin noted, China’s leading position is primarily due to large-scale imports into Ukraine, which amounted to $13.90 billion over the six-month period. At the same time, exports of Ukrainian goods to China reached only $778.4 million. The negative trade balance exceeded $13.12 billion, with almost $18 in imports for every dollar of Ukrainian exports.
“Ukraine receives significantly more technologically advanced products from China – electric batteries, telecommunications equipment, optical equipment, transformers, and so on. This is precisely one of the key structural challenges of Ukraine’s foreign trade. As before, we largely export products with relatively low added value, while importing more complex industrial and technological goods,” the expert emphasized.
According to him, Ukraine mainly supplies China with agricultural products and raw materials, particularly vegetable oils and soybeans.
Poland remains the largest individual market for Ukrainian exports: over six months, goods worth $2.38 billion were supplied to the country, while imports from Poland amounted to $4.67 billion. The bilateral trade deficit reached $2.29 billion. Ukraine exports vegetable oils, metals, ore, and soybeans to Poland, while importing, in particular, energy products and fertilizers.
Exports to Turkey amounted to $1.78 billion against imports of $3.12 billion, while exports to Germany totaled $1.27 billion and imports $3.21 billion, respectively. Urakin pointed out that Ukrainian goods entering the German market include cables, furniture, and pipes alongside agricultural products. Trade with the United States also remained in deficit: imports reached $2.49 billion against exports of $586.7 million.
At the same time, Ukraine recorded a positive foreign trade balance, in particular, with Spain (+$578.1 million), Egypt (+$527.1 million), Moldova (+$467.2 million), Algeria (+$309.2 million), and the Netherlands (+$221.5 million). The expert emphasized the importance of North African and Middle Eastern countries as markets for Ukrainian products, even if they are not among the largest partners in terms of total trade turnover.
A comparison of actual trade relations with public priorities revealed differences. According to a survey conducted by Experts Club jointly with Active Group in August 2026, 69.9% of respondents named the EU and the United Kingdom as desirable trading partners for Ukraine, the United States – 11.9%, China – 8.4%, and Southeast Asian countries – 5.5%.
“Here we see an interesting gap between public perception and economic geography. China is Ukraine’s largest trading partner, but fewer than 10% of respondents identify the development of trade with it as a priority. On the other hand, almost 70% are primarily oriented toward the EU and the United Kingdom,” Urakin noted.
“Ukraine should not regard these directions as mutually exclusive. European integration is objectively becoming the foundation of the country’s long-term economic model. At the same time, Ukraine needs to preserve and expand markets for its products in Asia, the Middle East, and Africa,” the expert emphasized.
In his assessment, the key task remains increasing the share of high-value-added goods – industrial products, technologies, and services – in Ukrainian exports.
For more details, watch the video at the following link:
You can subscribe to the Experts Club channel here:
ECONOMICS, EXPERTS CLUB, OLEKSANDR POZNII, SOCIOLOGY, URAKIN

In August 2026, the majority of Ukrainians maintained a neutral attitude toward Saudi Arabia—57.5% of respondents gave this answer. Twenty-nine percent of those surveyed viewed the country positively, while 9% viewed it negatively. Compared to the previous wave of the survey, the distribution of opinions changed only slightly, according to the Experts Club Information and Analytical Center.
According to the results of the August survey, 5.5% of Ukrainians have a completely positive attitude toward Saudi Arabia, while 23.5% have a mostly positive attitude. A neutral stance is held by 57.5% of respondents. Seven percent view the country mostly negatively, 2% view it entirely negatively, and another 4.5% were undecided.
The balance of positive and negative assessments stands at plus 20 percentage points. Thus, positive attitudes outnumber negative ones by more than three to one; however, the large neutral group remains the defining characteristic of perceptions of Saudi Arabia. In the overall picture of Ukrainians’ attitudes toward Middle Eastern countries, Saudi Arabia also ranks among those toward which neutral assessments predominate.
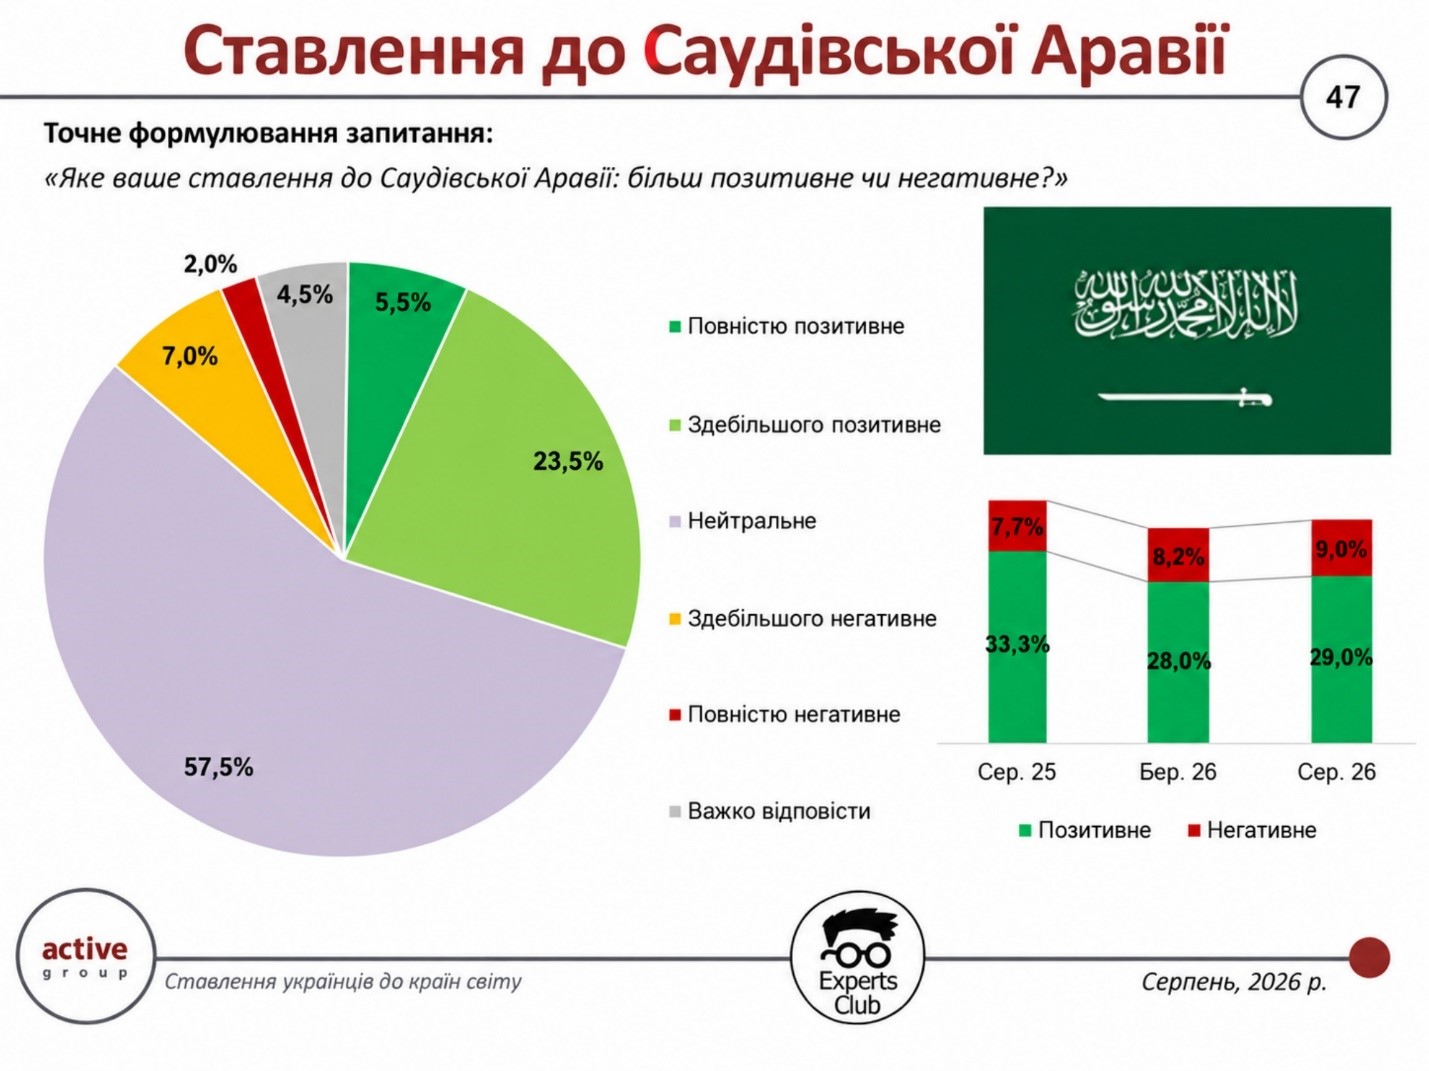
Compared to March 2026, the figures remained nearly stable. In the previous survey, 8.4% of respondents had a completely positive attitude toward Saudi Arabia, and 19.6% had a mostly positive attitude—meaning the combined share of positive responses was 28%. A neutral stance was held by 58.7% of respondents, 8.2% viewed the country negatively, and another 5.1% were undecided.
Thus, over the course of five months, the share of positive assessments increased by 1 percentage point—from 28% to 29%—while negative assessments rose by 0.8 percentage points, to 9%. The neutral segment decreased by 1.2 percentage points. The balance between positive and negative attitudes remained virtually unchanged: approximately +19.8 percentage points in March and +20 percentage points in August.
At the same time, changes occurred within the positive segment. The share of fully positive assessments fell from 8.4% to 5.5%, while the share of mostly positive assessments rose from 19.6% to 23.5%. In other words, the overall share of favorable responses remained stable but became less categorical.
Maksym Urakin, founder of the Experts Club Information and Analytical Center and a candidate of economic sciences, commenting on the survey results and the significant share of neutral attitudes toward a number of Ukraine’s partners, emphasized the need for more active public communication.
“The first recommendation is to regularly showcase concrete achievements, specific actions, and the presence here of foundations, embassies, teams, and diplomats in the humanitarian sphere and in science. Second, we must be open to questions and inquiries from the media and the public. We also need to use our sociological data to draw conclusions and strengthen our relationships, particularly trade relations,” Urakin noted.
In the case of Saudi Arabia, the results of the two survey waves show a high degree of stability in public perceptions. Nearly three-fifths of Ukrainians continue to hold a neutral position, while positive attitudes consistently outweigh negative ones by approximately 20 percentage points.
The survey was conducted in August 2026 using an online self-administered questionnaire via the SunFlowerSociology panel among 800 Ukrainian citizens aged 18 and older. The previous survey wave in March also included 800 respondents; the sample was representative by age, gender, and region, with a maximum theoretical margin of error of ±3.5 percentage points for indicators at the 50% confidence level.
ACTIVE GROUP, EXPERTS CLUB, international relations, MIDDLE EAST, PUBLIC OPINION, SAUDI ARABIA, SOCIOLOGY, UKRAINE, URAKIN

A neutral stance continues to dominate Ukrainians’ attitudes toward Egypt: in August 2026, 61.3% of respondents expressed this view. 28.1% of those surveyed view the country positively, while 6.9% view it negatively. Compared to March, the share of positive assessments has decreased, while the share of negative ones has increased, according to the Experts Club Information and Analytical Center.
According to the results of the August survey, 7.2% of Ukrainians have a completely positive attitude toward Egypt, while 20.9% have a mostly positive attitude. A neutral stance is held by 61.3% of respondents. 6.3% view the country mostly negatively, 0.6% view it entirely negatively, and another 3.7% were undecided.
The balance of positive and negative assessments based on these indicators is +21.2 percentage points. Thus, positive attitudes toward Egypt are roughly four times more prevalent than negative ones; however, the high proportion of neutral responses remains the defining characteristic of how the country is perceived.
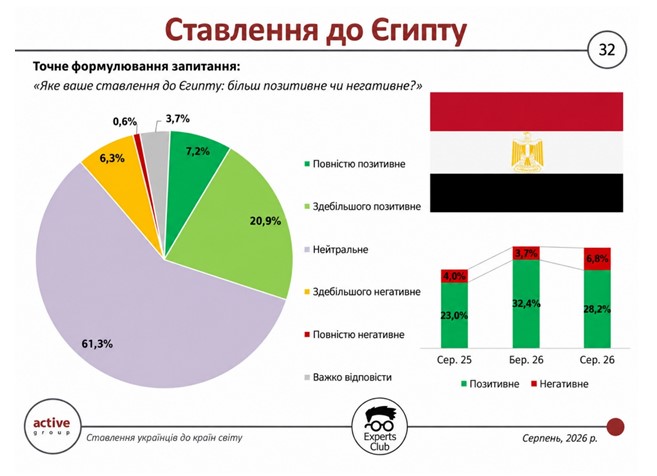
Compared to March 2026, attitudes have deteriorated slightly. In the previous survey wave, 10.5% of respondents rated Egypt entirely positively, and 21.9% rated it mostly positively—meaning the overall positive rating stood at 32.4%. 62.5% of respondents were neutral, and the share of negative ratings in the aggregated results was about 3.7%.
Thus, over the course of five months, the share of positive responses decreased by 4.3 percentage points—from 32.4% to 28.1%—while the share of negative responses increased by approximately 3.2 percentage points—to 6.9%. The share of neutral assessments changed only slightly—from 62.5% to 61.3%. The balance between positive and negative attitudes decreased from approximately plus 28.7 to plus 21.2 percentage points, respectively.
Maksym Urakin, founder of the Experts Club information and analytical center and a candidate of economic sciences, believes that the case of Egypt clearly illustrates the difference between a country’s economic importance to Ukraine and the extent of its presence in the public consciousness.
“Egypt is a very important export market for Ukraine, primarily for agricultural and food products. At the same time, for most Ukrainians, this country remains more of a tourist destination than an economic partner. That is precisely why we see such a high proportion of neutral assessments: economic ties are significant, but they are not always visible to the general public,” Urakin noted.
According to him, the positive trade balance with Egypt makes this market particularly important for Ukraine amid a general foreign trade deficit.
“When a country provides Ukraine with a significant trade surplus, it is no longer a secondary partner. Such markets must be viewed strategically—in terms of maintaining exports, expanding the range of goods supplied, and fostering long-term economic ties. In the case of Egypt, the potential for this is obvious, but public perception has simply not yet caught up with the country’s actual economic role,” Urakin added.
Thus, Egypt demonstrates a noticeable gap between its economic significance and public perception. Despite the fact that the country is one of Ukraine’s most profitable trading partners in terms of the trade balance, over 60% of Ukrainians continue to view it neutrally. This indicates limited awareness and low emotional engagement rather than a negative attitude.
The survey was conducted in August 2026 using self-administered online questionnaires in the SunFlowerSociology panel among 800 Ukrainian citizens aged 18 and older. The previous wave also included 800 respondents; the sample was representative by age, gender, and region, with a maximum theoretical margin of error of ±3.5 percentage points for indicators at the 50% confidence level.
ACTIVE GROUP, EGYPT, EXPERTS CLUB, FOREIGN TRADE, international relations, NORTH AFRICA, PUBLIC OPINION, SOCIOLOGY, UKRAINE, URAKIN
Ukrainians’ positive attitude toward Bulgaria in August 2026 declined compared to the previous phase of the study: 42.7% of respondents view the country positively, down from 53.8% in March. At the same time, Ukrainians with a neutral attitude became the largest group—47.6%, according to the Experts Club Information and Analytical Center.
According to the results of the August survey, 11% of Ukrainians have a completely positive attitude toward Bulgaria, while 31.7% have a mostly positive attitude. A neutral stance is held by 47.6% of respondents. A mostly negative attitude was expressed by 6.8%, a completely negative attitude by 0.6%, and another 2.3% were undecided.
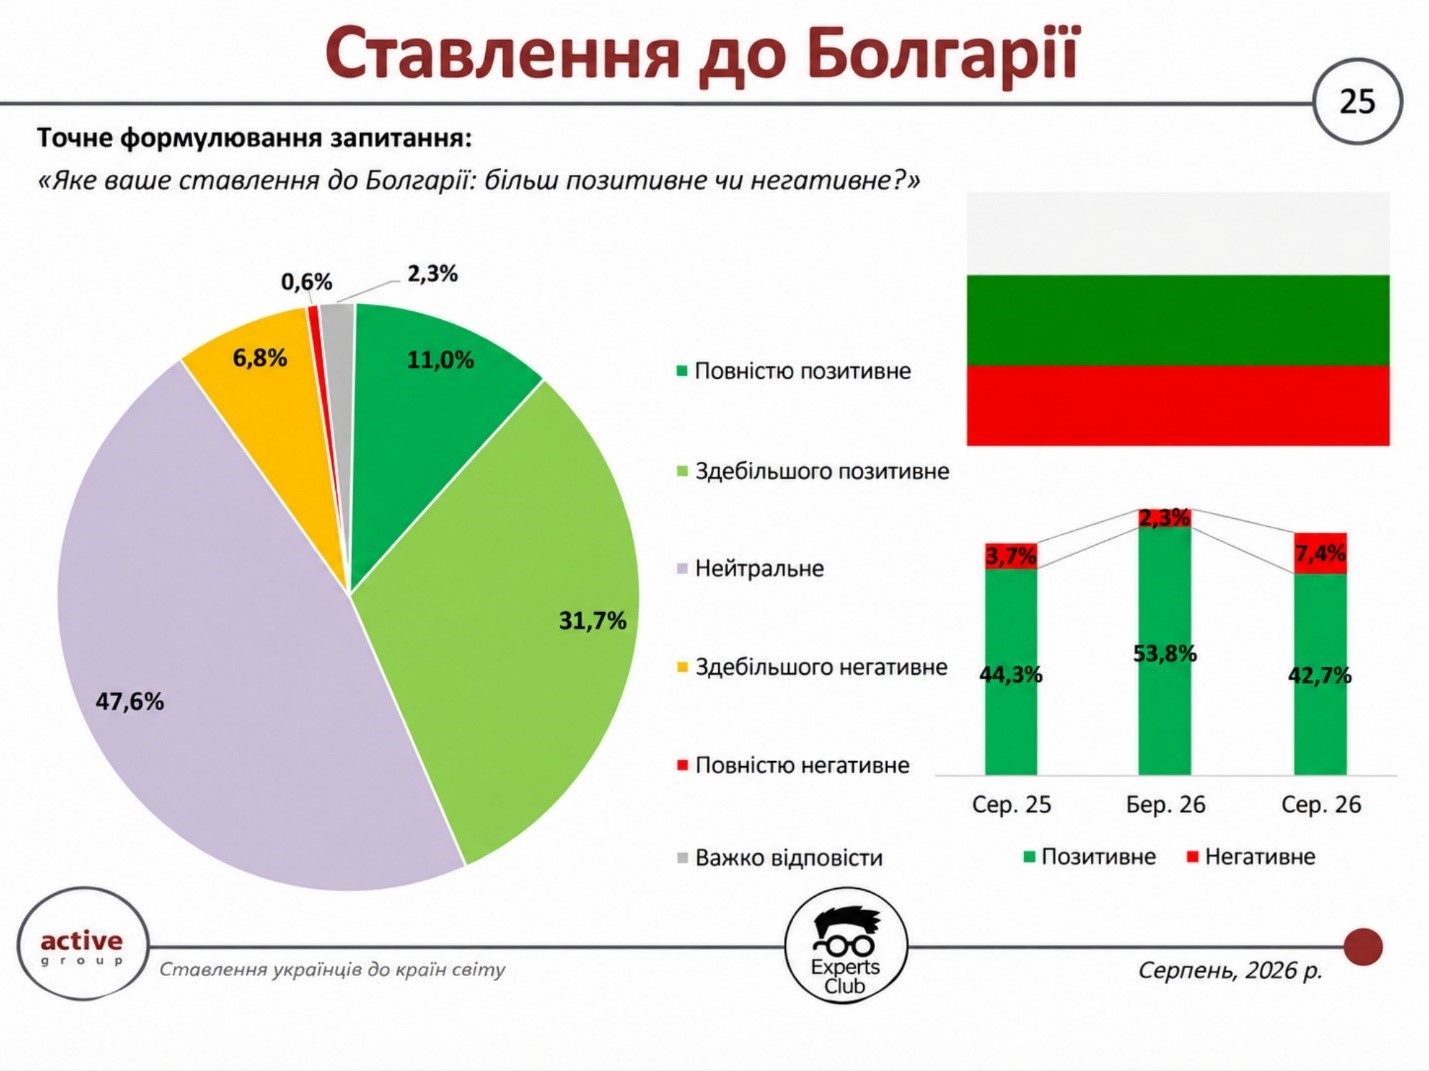
Thus, the combined share of negative assessments is 7.4%, and the balance between positive and negative attitudes is +35.3 percentage points. Despite a decline in positive ratings, favorable assessments of Bulgaria are nearly six times higher than negative ones. At the same time, nearly one in two respondents expresses neither a positive nor a negative attitude toward the country.
Compared to March 2026, the changes are quite noticeable. In the previous survey, 14.2% of respondents viewed Bulgaria entirely positively, and another 39.6% viewed it predominantly positively. The overall positive rating stood at 53.8%, the neutral rating at 42.4%, while negative assessments accounted for only 2.3%.
Over the course of five months, the share of positive responses fell by 11.1 percentage points—from 53.8% to 42.7%. Negative attitudes increased by 5.1 percentage points—from 2.3% to 7.4%—while neutral attitudes rose by 5.2 percentage points to 47.6%. The balance of positive and negative assessments fell from approximately plus 51.5 percentage points in March to plus 35.3 percentage points in August.
At the same time, the “mostly positive” category saw the sharpest decline—from 39.6% to 31.7%—while the share of entirely positive responses fell from 14.2% to 11%. Thus, the deterioration in the indicators occurred simultaneously due to growth in both the neutral and negative segments.
Maksym Urakin, founder of the Experts Club information and analytical center and a candidate of economic sciences, had previously drawn attention specifically to the significant share of uncertain or neutral perceptions of Bulgaria.
“This result indicates not so much indifference as the lack of an active Bulgarian presence in Ukraine’s information space,” Urakin noted. In his view, the problem lies not so much in an established negative image as in the country’s insufficient visibility to the Ukrainian audience. More active communication in the areas of economic, humanitarian, and other practical cooperation could help foster a more defined attitude.
The latest round of the survey partially confirms the validity of this assessment: the share of neutral respondents has once again approached half. At the same time, unlike in March, the share of negative responses has also increased, although it remains significantly lower than the share of positive responses.
The survey was conducted in August 2026 using self-administered online questionnaires from the SunFlowerSociology panel among 800 Ukrainian citizens aged 18 and older. The previous round of the survey in March also included 800 respondents; the sample was representative by age, gender, and region, with a maximum theoretical margin of error of ±3.5 percentage points for indicators at the 50% level.
ACTIVE GROUP, BULGARIA, CENTRAL AND EASTERN EUROPE, EUROPEAN UNION, EXPERTS CLUB, international relations, PUBLIC OPINION, SOCIOLOGY, UKRAINE, URAKIN
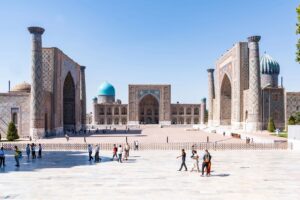
In August 2026, Ukrainians’ attitudes toward Uzbekistan remain predominantly neutral: 55.6% of respondents hold this view. Taking these categories together, 25.7% of those surveyed view the country positively, while 14.5% view it negatively, according to the Experts Club Information and Analytical Center. In the summary report, the positive figure is listed as 25.6%, which is due to the rounding of the raw data.
6.5% of Ukrainians have a completely positive attitude toward Uzbekistan, while 19.2% have a mostly positive attitude. 55.6% of respondents chose a neutral response. 13.1% view the country mostly negatively, 1.4% completely negatively, and another 4.3% were undecided.
When the categories are combined, the balance between positive and negative attitudes is +11.2 percentage points. Positive assessments thus outnumber negative ones by approximately 1.8 times. At the same time, more than half of those surveyed do not express a strong positive or negative stance toward the country.
In the overall regional picture, Uzbekistan has a less pronounced positive image than Georgia and Azerbaijan. In August, positive assessments stood at 57.3% for Georgia and 48.7% for Azerbaijan, while a high proportion of neutral responses remains the key feature of perceptions toward Uzbekistan.
At the same time, compared to the April 2025 survey, attitudes have become more defined. At that time, 63.4% of Ukrainians held a neutral stance toward Uzbekistan, 21.7% had a positive view, 9.3% had a negative view, and 5.6% were undecided. Thus, the positive segment grew by approximately 4 percentage points, the negative segment by 5.2 percentage points, and the share of neutral responses decreased by 7.8 percentage points.
Maksym Urakin, founder of the Experts Club Information and Analytical Center and a candidate of economic sciences, believes that a key factor in how Uzbekistan is perceived remains Ukrainians’ lack of awareness about the country’s current role in Central Asia.
“For a significant portion of Ukrainian society, Uzbekistan remains a rather distant country. People are exposed to far less information about its economy, business, politics, or humanitarian ties than they are about EU countries, the Caucasus, or Ukraine’s immediate neighbors. That is precisely why the neutral group still accounts for more than half of the respondents,” Urakin noted.
At the same time, he said, the decline in the share of neutral responses—from 63.4% in April 2025 to 55.6% in August 2026—is a more significant signal than the individual increase in positive or negative assessments.
“We are seeing the gradual formation of a more defined image of Uzbekistan. Some respondents are shifting from a neutral stance to a specific assessment of the country. At the same time, positive attitudes still significantly outweigh negative ones. This means that there is a sufficiently favorable foundation for the development of economic, educational, cultural, and humanitarian ties, but the image of Uzbekistan in Ukraine still requires a greater informational presence,” Urakin added.
The current results partially confirm this assessment: the neutral group remains the largest, but it has shrunk significantly compared to 2025. The simultaneous increase in both positive and negative responses indicates, above all, the gradual formation of a more defined attitude toward Uzbekistan.
The survey was conducted in August 2026 using an online self-administered questionnaire via the SunFlowerSociology panel among 800 Ukrainian citizens aged 18 and older. The sample is representative by age, gender, and region; the maximum theoretical margin of error for indicators at the 50% confidence level is ±3.5 percentage points.
ACTIVE GROUP, Central Asia, EXPERTS CLUB, international relations, PUBLIC OPINION, SOCIOLOGY, UKRAINE, URAKIN, UZBEKISTAN
Spain continues to strengthen its positive image among Ukrainians: in August 2026, 65.2% of respondents expressed a positive attitude toward the country, while only 1.6% expressed a negative one. Compared to the previous survey, the share of positive assessments has increased, while negative attitudes remain at a minimal level, according to the Experts Club Information and Analytical Center.
According to the results of the August survey, 23.9% of Ukrainians have a completely positive attitude toward Spain, and 41.3% have a mostly positive attitude. A neutral stance is held by 31.3% of respondents. 1.4% view the country mostly negatively, only 0.2% view it entirely negatively, and another 2% were undecided.
The balance of positive and negative assessments stands at plus 63.6 percentage points. Thus, positive attitudes toward Spain outweigh negative ones by more than 40 times, and over 96% of respondents view the country positively or neutrally.
Compared to March 2026, attitudes toward Spain have improved. In the previous survey, 18.9% of respondents described their attitude as entirely positive, and 44.8% as mostly positive. The overall positive rating stood at 63.6%, the negative rating at 0.9%, and 33.6% of respondents held a neutral position.
Over the course of five months, the share of positive assessments increased by approximately 1.6 percentage points—to 65.2%. At the same time, there were changes within the positive group: the share of “entirely positive” responses rose by 5 percentage points—from 18.9% to 23.9%—while the share of “mostly positive” responses declined slightly. The share of neutral assessments decreased from 33.6% to 31.3%.
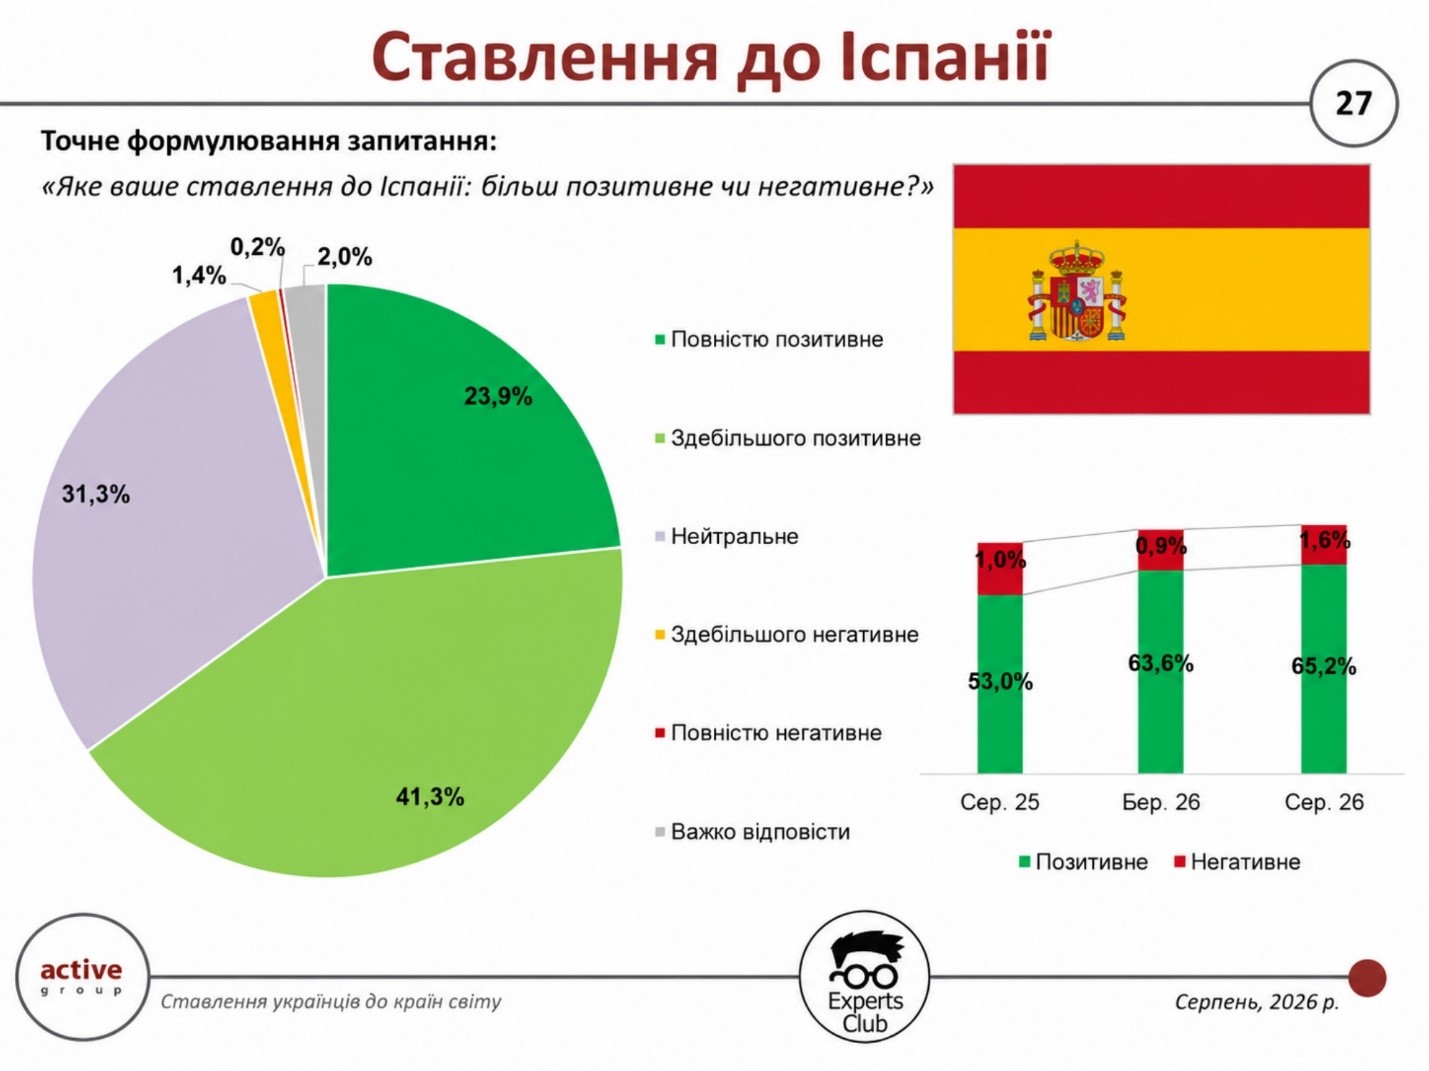
This continues the positive trend observed in previous waves of the survey: in August 2025, the balance of positive and negative attitudes toward Spain stood at approximately plus 52 percentage points; in March 2026, it was approximately plus 62.7 percentage points; and in August, it was plus 63.6 percentage points.
Spain remains not only one of the most positively perceived European countries but also one of Ukraine’s most advantageous trading partners. Recently, Spain has been among the leaders in terms of a trade surplus for Ukraine—that is, Ukrainian exports to this country significantly exceed imports. This makes the Spanish market particularly important in terms of foreign exchange earnings, export diversification, and the presence of Ukrainian businesses in the EU market.
Maksym Urakin, founder of the information and analytical center Experts Club, notes that in this case, the country’s positive public image is combined with real economic benefits for Ukraine.
“Spain is not only a country with a consistently positive image among Ukrainians but also one of Ukraine’s most advantageous economic partners. Recently, it has demonstrated a very strong position in bilateral trade and stands out as one of the leaders in terms of a trade surplus favorable to Ukraine. The combination of economic benefits, political support, humanitarian openness, and a positive public attitude forms a very solid foundation for the further development of Ukrainian-Spanish relations,” Urakin noted.
Oleksandr Pozniy, director of the research company Active Group, attributed the positive perception of Spain to a combination of political, humanitarian, and social factors.
“Spain actively supports Ukraine on the international stage, provides humanitarian aid, and creates favorable conditions for Ukrainian displaced persons. At the same time, cultural openness and traditional ties between our peoples reinforce this positive image. Therefore, there is virtually no mistrust or criticism of Spain within Ukrainian society,” Pozniy noted.
The latest wave of the survey generally confirms this trend. The increase in the share of entirely positive assessments, coupled with an extremely low level of negative sentiment, indicates that Spain continues to enjoy a consistently positive image among the Ukrainian public.
The survey was conducted in August 2026 using self-administered online questionnaires in the SunFlowerSociology panel among 800 Ukrainian citizens aged 18 and older. In the previous wave conducted in March, 800 respondents were also surveyed, and the sample was representative by age, gender, and region.
ACTIVE GROUP, EXPERTS CLUB, international relations, Pozniy, PUBLIC OPINION, SOCIOLOGY, SPAIN, TRADE, UKRAINE, URAKIN



