
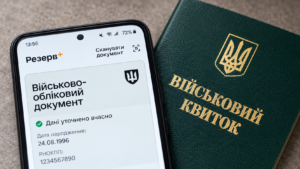
Ukraine is preparing another review of its military personnel reservation rules, which could affect companies operating in the defense industry, energy sector, utilities and other sectors considered critical to the national economy. However, the final parameters of the proposed changes remain under discussion, and reports of a mass cancellation of existing exemptions have not yet been sufficiently substantiated, according to the Experts Club information and analytical center.
According to information published on October 22 by Dmytro Kysylevskyi, deputy chairman of the parliamentary committee on economic development, the Cabinet of Ministers plans to finalize the adoption of a new resolution by the end of the week. A provision that would have excluded employees with individual mobilization deferments from the total number of eligible employees used to calculate reservation quotas has already been removed from the draft.
Earlier proposals included reducing the maximum reservation quota for certain defense and energy companies from 100% to 85%, and for water supply, heating and waste management companies from 75% to 60%. However, these figures appeared in earlier versions of the draft and cannot be regarded as approved regulations.
According to Experts Club, the most vulnerable groups could include employees of companies that lose their critically important status, fail to confirm compliance with government criteria within the required period, or face reductions in available reservation quotas. Under existing regulations, an employer’s loss of critical status can already result in the automatic cancellation of its employees’ reservations.
Another issue concerns the distinction between essential operational personnel and support staff. One approach under discussion would preserve broader exemptions for specialists directly involved in defense manufacturing, equipment maintenance and critical infrastructure operations. However, no definitive list of positions potentially subject to restrictions has been approved.
The draft also provides for establishing a Coordination Center under the Cabinet of Ministers. The center is expected to assess the justification for criteria used to designate companies as critically important and recommend revisions. Final decisions would remain with the relevant government authorities.
Separately, legislative proposals concerning family-based mobilization deferments are also being discussed. They could introduce additional requirements for parents of children with disabilities, spouses of people with disabilities, caregivers of ill relatives and legal guardians. These initiatives are not part of the government’s resolution on reservation quotas and do not currently alter existing statutory protections.
The Ministry of Defense previously announced that more than 90% of existing individual deferments could potentially be extended automatically using information from state registers. The relevant procedure will continue until October 30, 2026. Failure to verify information automatically does not, by itself, mean that a person has lost their legal entitlement to a deferment.
Business representatives emphasize that frequent regulatory changes complicate workforce planning, contract fulfillment and uninterrupted operations. Experts Club analysts believe that the effectiveness of the reform should be measured not only by the number of reservations reviewed, but also by the state’s ability to meet defense needs, prevent abuse and maintain the functioning of critical industries.
DEFERMENTS, EXPERTS CLUB, MILITARY RESERVATIONS, mobilization
The European Union is facing significant disagreements over its long-term budget for 2028–2034, raising concerns about potential delays in approving up to €100 billion in financial assistance for Ukraine, according to the Experts Club information and analytical center.
Following the European Council summit on October 15–16, 2026, EU leaders failed to agree on the main parameters of the next Multiannual Financial Framework (MFF). Reaching a political compromise by the end of 2026 remains a negotiating objective rather than a legally binding deadline.
The European Commission’s original proposal, presented in July 2025, envisaged a seven-year budget of €1.763 trillion in constant 2025 prices, equivalent to almost €2 trillion in current prices. However, on October 10, 2026, Ireland, which holds the rotating presidency of the Council of the EU, proposed reducing the framework to €1.622 trillion. The reduction amounts to €141 billion, or approximately 8%.
The largest proposed reduction concerns competitiveness, security and innovation programs, with funding cut by €66.6 billion. External action programs face a €33.1 billion reduction, while regional development and agricultural programs could lose €32.2 billion.
The main disagreements are between major net contributors to the EU budget, including Germany, the Netherlands and Sweden, and countries seeking to preserve agricultural and regional subsidies. Rising defense spending, technological modernization requirements and the repayment of NextGenerationEU debt add further pressure.
According to EU budget documents, approximately €149.3 billion in constant 2025 prices is earmarked for servicing and repaying joint European borrowing during 2028–2034. These obligations reduce the resources available for new investment programs.
The European Parliament opposes the proposed cuts. Its negotiating position provides for financial resources approximately €316 billion higher than the Irish proposal, taking into account separate funding for debt repayment.
For Ukraine, the most significant development is the preservation of a dedicated financial reserve totaling €88.869 billion in constant 2025 prices. This corresponds to approximately €100 billion in current prices, as originally proposed by the European Commission.
The mechanism would support Ukraine’s economy, infrastructure reconstruction and European integration through grants, budget guarantees and lending instruments. However, the proposed allocation does not constitute approved funding, and actual disbursements will depend on subsequent EU decisions.
Negotiations are further complicated by the European electoral calendar, including parliamentary elections in Spain in late 2026 and presidential elections in France in spring 2027. These developments could encourage national governments to postpone politically sensitive decisions on increasing budget contributions.
Experts Club identifies three possible scenarios: reaching a compromise before the end of 2026, postponing an agreement until the first half of 2027, or allowing negotiations to continue until late 2027.
“The main risk for Ukraine is not an immediate reduction of the proposed €100 billion, but a possible delay in the legal approval and practical implementation of financial support after 2027,” the Experts Club analysis states.
A delay in adopting the new budget would not automatically suspend EU funding, as European treaties provide for the temporary extension of existing budgetary ceilings. Nevertheless, prolonged negotiations could complicate the launch of new programs, including long-term financial assistance mechanisms for Ukraine.
China retained first place among Ukraine’s trading partners in January–June 2026, with total trade turnover of $14.68 billion, more than twice Poland’s figure ($7.05 billion), according to a foreign trade analysis presented by Maksym Urakin, founder of the Experts Club analytical center, in a video review of Ukraine’s foreign trade on the YouTube channel of the Experts Club information and analytical center.
The next positions in terms of bilateral trade volume were occupied by Turkey – $4.90 billion, Germany – $4.48 billion, and the United States – $3.07 billion. Italy, Hungary, the Netherlands, the Czech Republic, and Slovakia also entered the top ten.
As Urakin noted, China’s leading position is primarily due to large-scale imports into Ukraine, which amounted to $13.90 billion over the six-month period. At the same time, exports of Ukrainian goods to China reached only $778.4 million. The negative trade balance exceeded $13.12 billion, with almost $18 in imports for every dollar of Ukrainian exports.
“Ukraine receives significantly more technologically advanced products from China – electric batteries, telecommunications equipment, optical equipment, transformers, and so on. This is precisely one of the key structural challenges of Ukraine’s foreign trade. As before, we largely export products with relatively low added value, while importing more complex industrial and technological goods,” the expert emphasized.
According to him, Ukraine mainly supplies China with agricultural products and raw materials, particularly vegetable oils and soybeans.
Poland remains the largest individual market for Ukrainian exports: over six months, goods worth $2.38 billion were supplied to the country, while imports from Poland amounted to $4.67 billion. The bilateral trade deficit reached $2.29 billion. Ukraine exports vegetable oils, metals, ore, and soybeans to Poland, while importing, in particular, energy products and fertilizers.
Exports to Turkey amounted to $1.78 billion against imports of $3.12 billion, while exports to Germany totaled $1.27 billion and imports $3.21 billion, respectively. Urakin pointed out that Ukrainian goods entering the German market include cables, furniture, and pipes alongside agricultural products. Trade with the United States also remained in deficit: imports reached $2.49 billion against exports of $586.7 million.
At the same time, Ukraine recorded a positive foreign trade balance, in particular, with Spain (+$578.1 million), Egypt (+$527.1 million), Moldova (+$467.2 million), Algeria (+$309.2 million), and the Netherlands (+$221.5 million). The expert emphasized the importance of North African and Middle Eastern countries as markets for Ukrainian products, even if they are not among the largest partners in terms of total trade turnover.
A comparison of actual trade relations with public priorities revealed differences. According to a survey conducted by Experts Club jointly with Active Group in August 2026, 69.9% of respondents named the EU and the United Kingdom as desirable trading partners for Ukraine, the United States – 11.9%, China – 8.4%, and Southeast Asian countries – 5.5%.
“Here we see an interesting gap between public perception and economic geography. China is Ukraine’s largest trading partner, but fewer than 10% of respondents identify the development of trade with it as a priority. On the other hand, almost 70% are primarily oriented toward the EU and the United Kingdom,” Urakin noted.
“Ukraine should not regard these directions as mutually exclusive. European integration is objectively becoming the foundation of the country’s long-term economic model. At the same time, Ukraine needs to preserve and expand markets for its products in Asia, the Middle East, and Africa,” the expert emphasized.
In his assessment, the key task remains increasing the share of high-value-added goods – industrial products, technologies, and services – in Ukrainian exports.
For more details, watch the video at the following link:
You can subscribe to the Experts Club channel here:
ECONOMICS, EXPERTS CLUB, OLEKSANDR POZNII, SOCIOLOGY, URAKIN
Denmark continues to rank among the countries with the highest level of positive perception among Ukrainians: in August 2026, 66.9% of respondents viewed it positively, while only 1.8% viewed it negatively. Compared to March, the share of positive assessments has decreased slightly, but the overall attitude remains distinctly favorable, according to the Experts Club Information and Analytical Center.
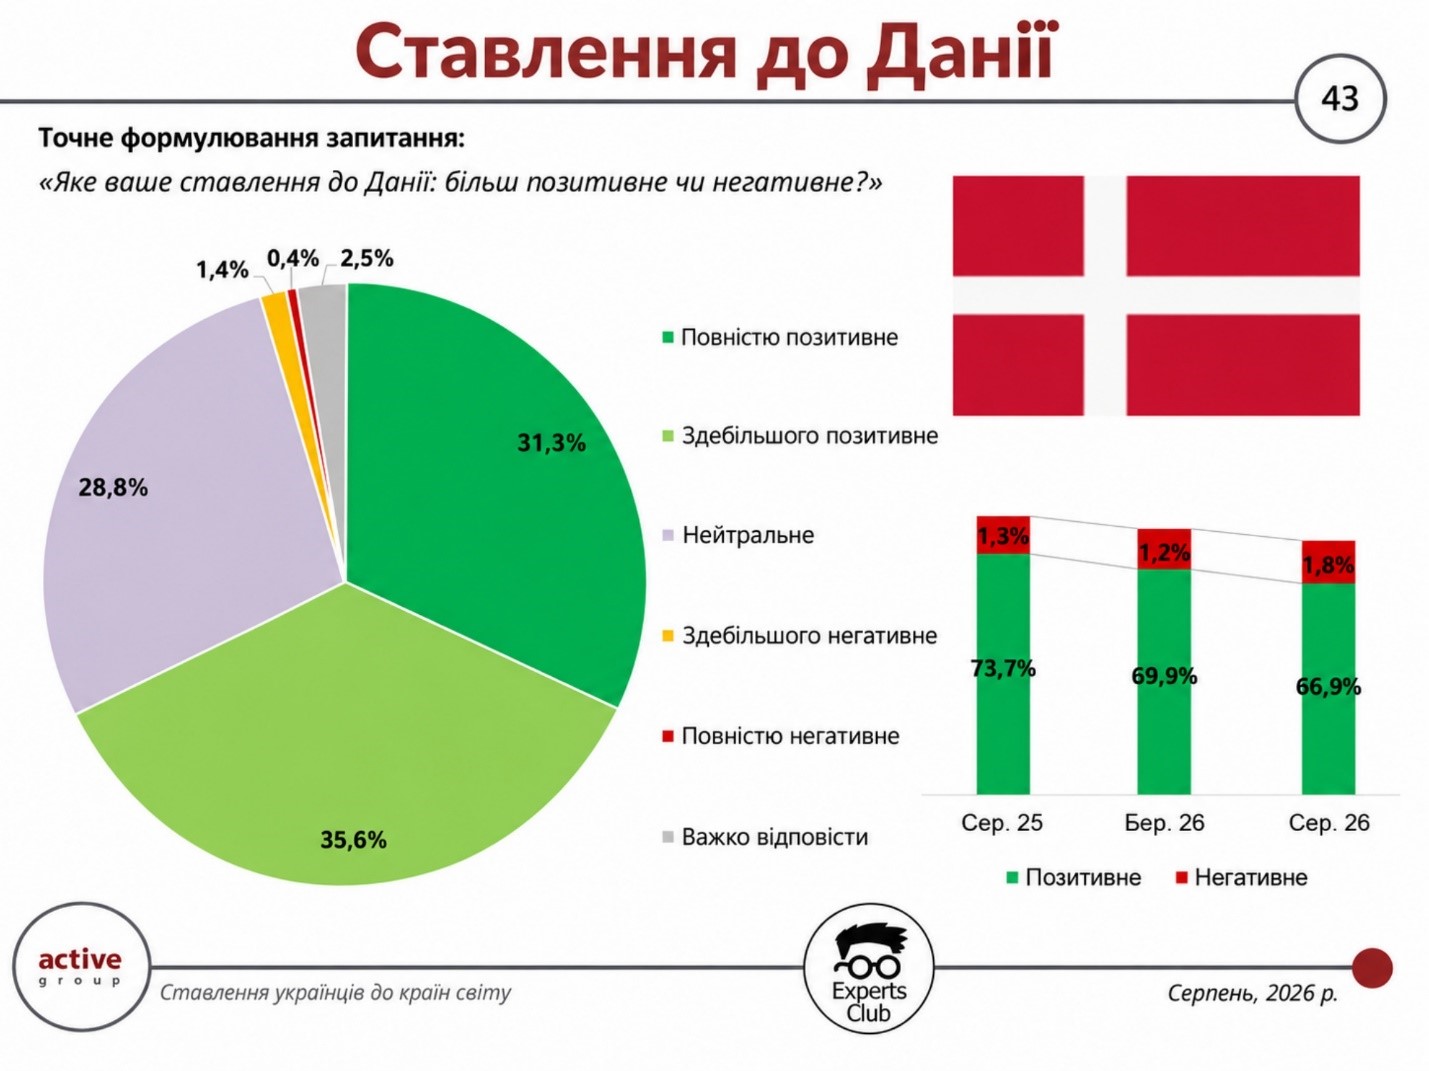
According to the results of the August survey, 31.3% of Ukrainians have a completely positive attitude toward Denmark, and 35.6% have a mostly positive attitude. A neutral stance is held by 28.8% of respondents. Only 1.4% expressed a mostly negative attitude, 0.4% a completely negative one, and another 2.5% were undecided.
The balance of positive and negative assessments stands at plus 65.1 percentage points. Thus, positive responses outnumber negative ones by more than 37 times. Denmark remains among the group of Northern European countries that enjoy very high public favor among Ukrainians.
In March 2026, 69.9% of respondents viewed Denmark positively: 33.3% viewed it entirely positively and 36.6% viewed it mostly positively. A neutral attitude was expressed by 26.8% of respondents, a negative one by only 1.2%, and another 2.1% were undecided.
Thus, over the course of five months, the share of positive assessments decreased by 3 percentage points—from 69.9% to 66.9%. The neutral segment increased by 2 percentage points—to 28.8%—while negative attitudes rose by only 0.6 percentage points. The balance of positive and negative assessments decreased from +68.7 to +65.1 percentage points, respectively.
There has also been a noticeable and definite decline in the intensity of positive attitudes: the share of fully positive responses fell from 33.3% to 31.3%, and that of mostly positive responses—from 36.6% to 35.6%. At the same time, the increase in the negative segment remains minimal, so the current trend suggests that some respondents are shifting to a neutral position rather than developing a critical attitude toward Denmark.
Oleksandr Pozniy, director of the research firm Active Group, commenting on Denmark’s high ratings in previous waves of the survey, noted: “Ukrainians perceive Denmark as a sincere partner and a reliable ally under the current circumstances. The high level of trust reflects both the humanitarian aid and Copenhagen’s consistent political support for Ukraine.” In the broader context of the survey, he also emphasized: “Ukrainians clearly associate the support received primarily from European Union countries and the United Kingdom with a positive attitude toward them.”
The latest wave of the survey shows that this positive image persists. Despite a decline in the figure compared to March, approximately two-thirds of Ukrainians continue to view Denmark positively, while the share of negative responses does not even reach 2%.
The previous wave of the survey was conducted in March 2026 among 800 Ukrainian citizens aged 18 and older using self-administered online questionnaires on the SunFlowerSociology panel. The sample was representative by age, gender, and region; the maximum theoretical margin of error for indicators at the 50% confidence level was ±3.5 percentage points.
ACTIVE GROUP, DENMARK, EUROPEAN UNION, EXPERTS CLUB, international relations, NORTHERN EUROPE, PUBLIC OPINION, SOCIOLOGY, UKRAINE
Ukrainians’ attitudes toward Israel in August 2026 remain predominantly positive or neutral; however, compared to the previous wave of the study, positive assessments have continued to decline. 35.6% of respondents have a positive attitude toward the country, 21.9% have a negative one, and another 39.7% hold a neutral position, according to the Experts Club Information and Analytical Center.
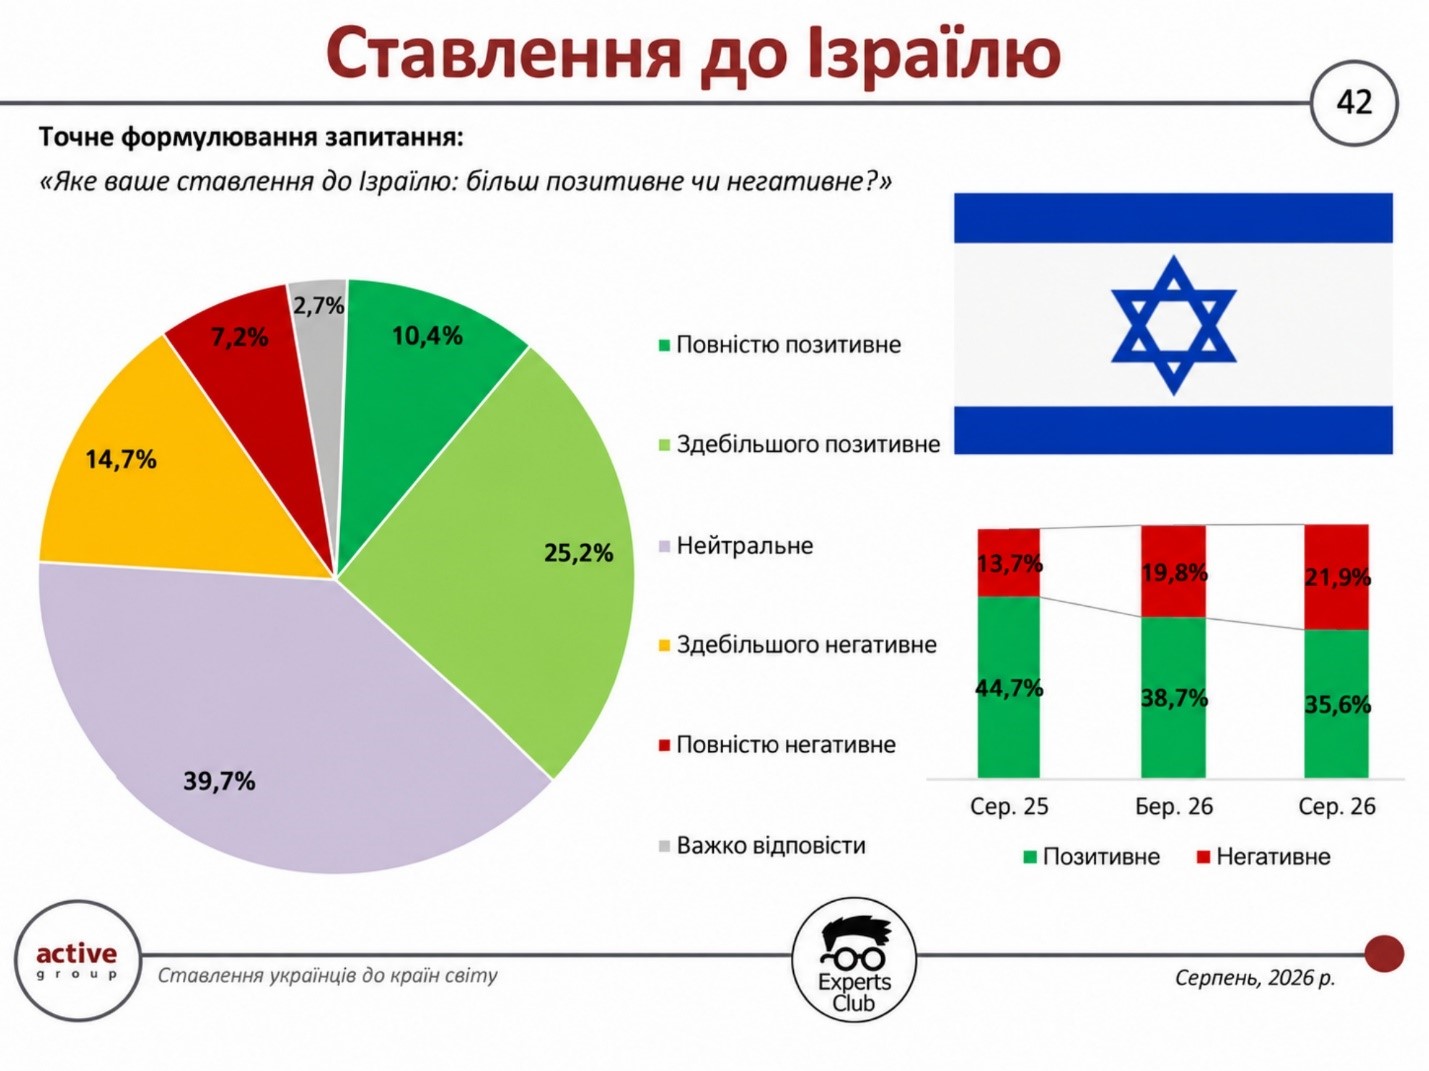
According to the results of the August survey, 10.4% of Ukrainians have a completely positive attitude toward Israel, while 25.2% have a mostly positive one. A neutral response was chosen by 39.7% of respondents. A mostly negative attitude was expressed by 14.7%, a completely negative one by 7.2%, and another 2.7% were undecided.
The balance of positive and negative assessments stands at plus 13.7 percentage points. This means that positive attitudes still outweigh negative ones, though the gap between them has narrowed significantly. Among Middle Eastern countries, Israel has a more polarized pattern of assessments than Saudi Arabia or Jordan, where neutral perceptions dominate.
In March 2026, 38.7% of respondents viewed Israel positively: 12.6% viewed it entirely positively and 26.1% viewed it mostly positively. A neutral stance was held by 38.2% of respondents, while 19.8% expressed a negative attitude, and another 3.3% were undecided.
Thus, over the course of five months, the share of positive assessments decreased by 3.1 percentage points—from 38.7% to 35.6%—while negative assessments increased by 2.1 percentage points—to 21.9%. The neutral segment increased by 1.5 percentage points. The balance between positive and negative attitudes decreased from plus 18.9 to plus 13.7 percentage points, respectively.
When comparing all three waves of the survey, the trend is even more pronounced. In August 2025, 44.7% of respondents viewed Israel positively, while 13.7% viewed it negatively; in March 2026, the figures were 38.7% and 19.8%, respectively; and in August, they were 35.6% and 21.9%. In other words, over the course of a year, the positive segment decreased by 9.1 percentage points, while the negative segment increased by 8.2 percentage points.
Maksym Urakin, founder of the Experts Club information and analytical center and a candidate of economic sciences, had previously drawn attention to the economic component of Ukrainian-Israeli relations.
“At the end of 2025, Ukraine’s bilateral trade with Israel totaled over $353 million. Ukrainian exports amounted to $132.4 million, while imports of Israeli goods exceeded $221 million. This resulted in a trade deficit of approximately $88.6 million. This imbalance indicates a need to expand Ukrainian exports and seek new niches in the Israeli market,” Urakin emphasized.
The latest wave of the survey shows a gradual decline in positive attitudes toward Israel, but not a shift into negative territory. Respondents with a neutral stance remain the largest single group, while positive assessments are still approximately 1.6 times more numerous than negative ones.
The survey was conducted in August 2026 using an online self-administered questionnaire via the SunFlowerSociology panel among 800 Ukrainian citizens aged 18 and older. The maximum theoretical margin of error for indicators at the 50% confidence level is ±3.5 percentage points.
ACTIVE GROUP, EXPERTS CLUB, FOREIGN TRADE, international relations, ISRAEL, MIDDLE EAST, PUBLIC OPINION, SOCIOLOGY, UKRAINE
Japan remains one of the Asian countries with the highest level of positive perception among Ukrainians: in August 2026, 67.7% of respondents viewed it positively, while only 3.3% viewed it negatively. At the same time, compared to the previous wave of the survey, the share of positive assessments has decreased slightly, according to the Experts Club Information and Analytical Center.
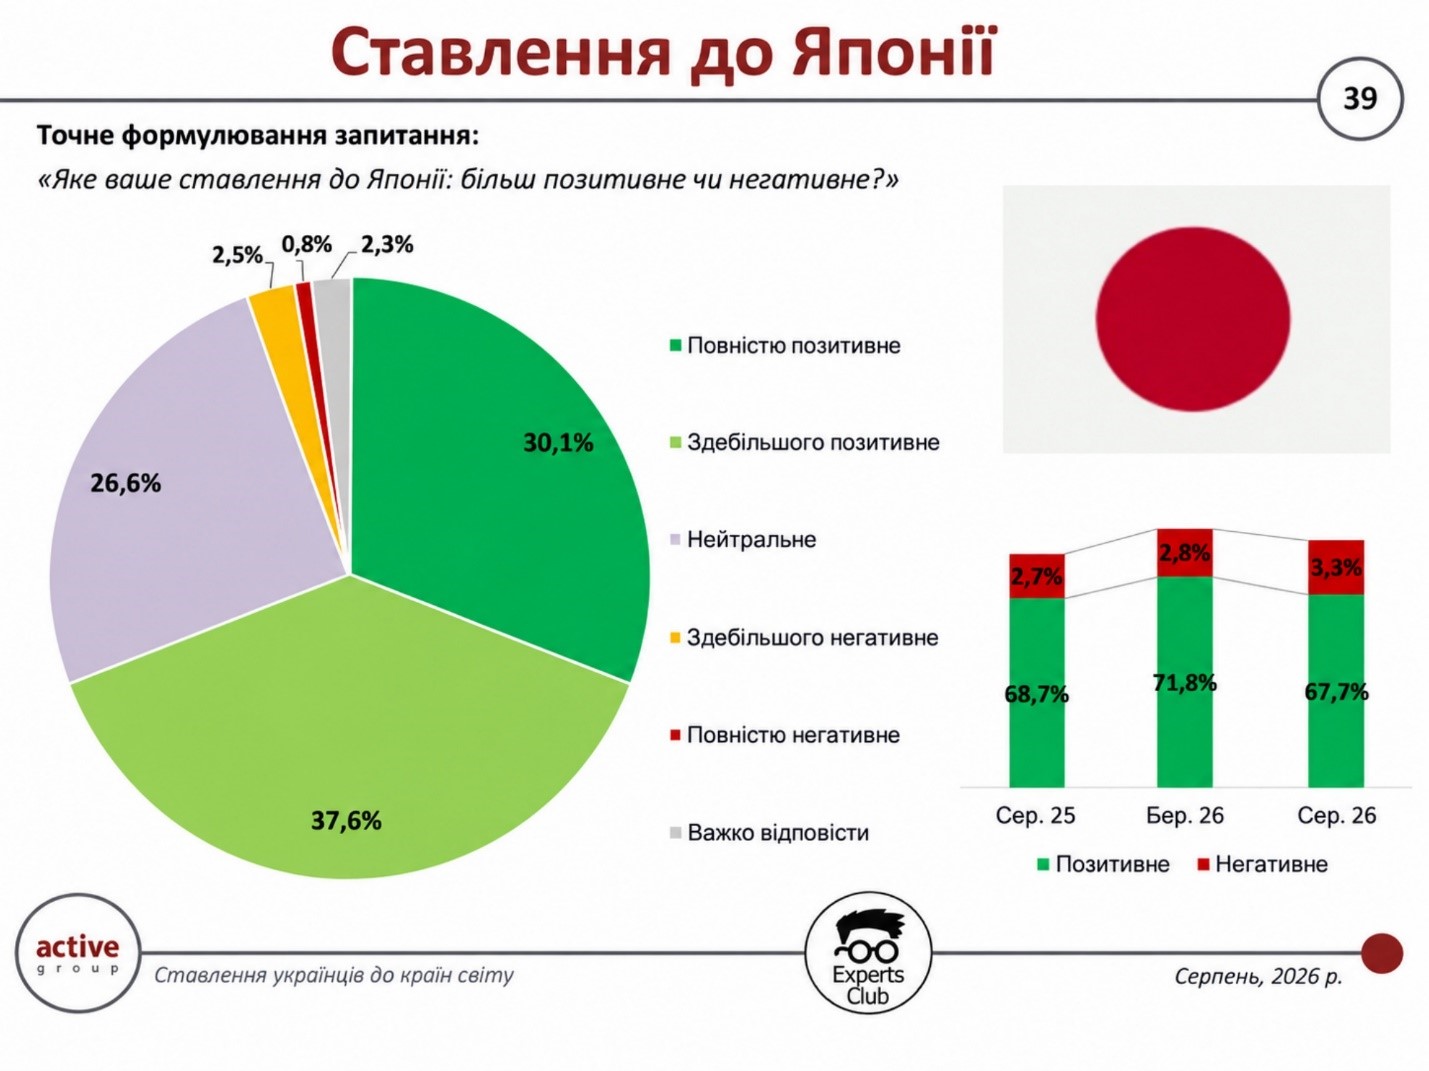
According to the results of the August survey, 30.1% of Ukrainians view Japan entirely positively, and 37.6% view it mostly positively. A neutral stance is held by 26.6% of respondents. 2.5% view the country mostly negatively, 0.8% view it entirely negatively, and another 2.3% were undecided.
The balance between positive and negative assessments stands at plus 64.4 percentage points. Thus, positive attitudes toward Japan outnumber negative ones by more than 20 to 1, and over two-thirds of respondents have a favorable perception of the country.
In March 2026, 71.8% of Ukrainians had a positive attitude toward Japan: 32.9% viewed it entirely positively and 38.9% viewed it mostly positively. A neutral stance was held by 24.2% of respondents, negative attitudes accounted for 2.8%, and another 1.2% were undecided.
Thus, over the course of five months, the share of positive assessments decreased by 4.1 percentage points—from 71.8% to 67.7%. The negative segment increased by only 0.5 percentage points—to 3.3%, while the share of neutral responses rose by 2.4 percentage points—to 26.6%. The balance between positive and negative attitudes decreased from plus 69 to plus 64.4 percentage points, respectively.
These trends primarily indicate a slight decline in the intensity of positive attitudes rather than the emergence of a negative image. The share of entirely positive responses fell from 32.9% to 30.1%, and that of mostly positive responses—from 38.9% to 37.6%. Negative assessments, meanwhile, remain at a very low level.
Oleksandr Pozniy, director of the research firm Active Group, commenting on the results of the previous wave of the survey, emphasized the stability of Japan’s positive image among Ukrainians.
“For Ukrainians, Japan is an example of a country with a high level of trust and a consistently positive image. We see that even without any major news events, perceptions of Japan are gradually improving. This means that a long-term reputation and a consistent policy of cooperation are far more effective than short-term media effects,” Pozniy noted.
The latest round of the survey shows a slight decline in the figures compared to March, but this does not change the overall picture: Japan continues to have a distinctly positive image in Ukrainian society, and negative attitudes toward it remain minimal.
The survey was conducted in August 2026 using self-administered online questionnaires in the SunFlowerSociology panel among 800 Ukrainian citizens aged 18 and older. The previous survey in March also included 800 respondents; the sample was representative by age, gender, and region, with a maximum theoretical margin of error of ±3.5 percentage points at the 50% confidence level.
ACTIVE GROUP, ASIA, EXPERTS CLUB, international relations, JAPAN, PUBLIC OPINION, SOCIOLOGY, UKRAINE



