In 2025, Nova Post Europe doubled the number of branches in 16 European countries to 800, Nova Post Europe CEO Oleksandr Lysovets said in an interview with Forbes Ukraine.
“At some point, we realized that instead of chasing the number of countries, it was better to focus on deepening our presence in existing markets… We started by copying the Ukrainian model, but quickly realized that each market requires its own logic for entry and scaling,” he explained the change in growth strategy.
According to Lysovets, in 2025, the largest number of branches were opened in Poland (32), Moldova (25), Germany and Spain (24 each), and the total number of employees reached 1,670.
The CEO specified that most of the 800 service points are partner branches and PUDO (pick-up/drop-off) based on partner businesses.
“The company is actively shifting its focus towards partnerships: last year, 90% of new service points were partner ones. But in each country, we look at the existing infrastructure,” Lysovets noted, citing the example of Poland, where InPost operates with over 25,000 parcel terminals, so there is no point in building its own network there.
He also said that Moldova is the only country in Europe where the strategy involves building a full-fledged infrastructure of its own, replicating the model of Nova Poshta in Ukraine. In particular, in 2025, a full-fledged franchise was launched there, with 21 partner branches.
The CEO of Nova Post Europe emphasized that in 2025, the company tripled in size in Moldova. Currently, EUR 2 million is being invested in a new sorting hub, which will be five times larger than the previous one. In particular, this amount is planned to be used to expand the physical presence, which will include, among other things, the installation of 150 parcel terminals, the opening of 150 PUDOs, six own branches, and 60 partner branches.
“The goal is to provide maximum coverage and convenience for customers,” Lysovets emphasized in an interview.
According to him, at the end of the fourth quarter of 2025, Nova Post Europe became profitable in Poland, Moldova, the Czech Republic, and Latvia.
The company, which processed 13 million international shipments last year, plans to increase this volume by more than 30% in 2026 and maintain this pace until 2030. As the CEO noted, these plans will be supported by a new phase of European expansion with investments of over $5 million. In particular, there are plans to launch an automated line in the Czech Republic and a proprietary CSS in Germany.
“In Poland, we are investing $1.8 million in opening 300 partner mini-branches, which will allow us to quickly expand the network using our partners’ existing infrastructure for effective scaling,” Lisovets added.
According to him, the amount of investment in Spain will be about $0.64 million, which will be used to open 50 PUDOs and 86 partner mini-branches.
The CEO also noted that, on average, Ukrainians account for about 60% of Nova Post’s customers abroad, but in Moldova, they account for less than 1%.
In October 2025, company co-founder Volodymyr Poperechnyuk announced that the Nova group of companies, which includes the express delivery leader Nova Poshta and the financial service NovaPay (TM NovaPay), plans to grow fourfold in five years.
The CEO of Nova Post Europe, in turn, noted that fourfold growth is impossible only within the framework of traditional delivery, the existing customer base, or without updating the service package.
“It’s not just about growing existing volumes, but about expanding the market itself for the company through new products, services, and usage scenarios. We see huge room for scaling where we haven’t even begun to truly unleash our potential,” Lysovets emphasized.

Chinese Foreign Minister Wang Yi, speaking on the sidelines of the Munich Security Conference, said that “the door to dialogue in Ukraine is open, and all parties should strive to reach a comprehensive and lasting peace agreement and eliminate the root causes of the conflict,” and called on Europe to be more active in peace efforts, according to a correspondent for Interfax-Ukraine.
“The doors to dialogue have finally opened on the ‘Ukrainian crisis’ (Russia’s full-scale war against Ukraine – IF-U). All interested parties should seize the opportunity to achieve a comprehensive, durable, and binding peace agreement, eliminate the root causes of the conflict, and ensure lasting peace and stability in Europe,” he said.
According to the Chinese foreign minister, Europe should not stand by and watch.
“Since the conflict broke out here in Europe, Europe has every right to participate in the negotiations at the appropriate time. Europe should not be on the menu, but at the negotiating table,” he said.
“Now we see that Europe has found the courage to negotiate with Russia. This is good, and we support it,” Wang Yi emphasized.
At the same time, in his opinion, dialogue should not be conducted for the sake of dialogue itself, and Europe should offer new ideas and new plans to resolve this issue.
” And in this process, we need to promote the creation of a more balanced, effective, and sustainable security architecture for Europe. Consequently, by doing so, we are addressing the root causes of the crisis and can prevent its recurrence. And to achieve sustainable and lasting peace, China, for its part, will fully support the peace process,” the foreign minister concluded.
He also clarified that China is not a party directly involved in the conflict, has no right to make a final decision, and is only facilitating peace talks.
Regarding relations between China and the EU, Wang Yi expressed his conviction that they should be partners, not systemic rivals or strategic competitors.
“But there are differences and disagreements between our two sides, for example, our social systems, our values, and our development models, but that is because we have different histories and cultures, and based on that, our peoples have different choices regarding the path of development. But that does not mean that we should become rivals or competitors,” the minister said.
He declared that it is more important for China and the EU to practice multilateralism, defend the authority of the UN, say “no” to unilateral practices, uphold free trade, and oppose bloc confrontation.
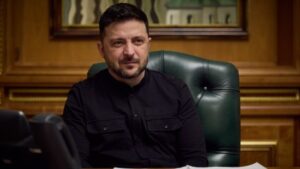
Ukraine will open ten export centers in European countries by the end of the current 2026, Ukrainian President Volodymyr Zelensky said.
“Today we are opening export centers. There will already be ten export centers in Europe in 2026. These are the Baltic countries, and the countries of Northern Europe. In 2026 there will be ten representative offices,” Zelensky said while communicating with teachers and students of the Kiev Aviation Institute on the occasion of the 120th anniversary of the birth of aircraft designer Oleh Antonov.
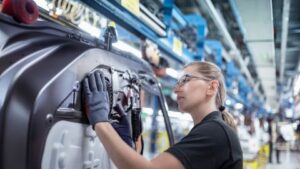
The average employment rate of Ukrainian refugees aged 20-64 in European countries in mid-2025 was 57%, including self-employment and informal work, which is 22 percentage points (pp) lower than the comparable figure for citizens of the host country, according to a UNHCR survey on the integration of Ukrainian refugees into the labor market.
“The results vary significantly: countries bordering Ukraine tend to have the highest employment rates, while Western and Northern European countries show significantly lower rates, even when differences in refugee profiles are taken into account,” the document, which is based on data from 6,817 respondents, notes.
According to the publication, 3% of those aged 20-64 (or 5% of those in work) are self-employed or entrepreneurs.
It is noted that proficiency in the local language is one of the strongest predictors of employment, and a longer stay in the host country is also associated with improved access to the labor market.
According to the data, Estonia and Hungary lead in terms of employment, with 72% and 71% respectively, followed by the United Kingdom (69%), Poland (68%), Bulgaria (67%), the Czech Republic (66%), and the Netherlands (64%).
Spain (61%), Italy (58%), Lithuania (57%), France (53%), Romania (50%), Moldova, Ireland, and Belgium (46% each) are close to the average.
According to the survey, the employment rates of Ukrainian refugees are significantly lower in Sweden (43%), Finland (40%), Denmark and Germany (39% each), Norway (37%), and Switzerland (29%).
“However, the problem of underemployment remains widespread. Nearly 60% of working refugees report that they are working below their skill level, and they are almost twice as likely as citizens of the country to hold low-skilled jobs,” the UNHCR document states.
According to the document, more than a third of refugees with higher education work in low-skilled professions, compared to 7% of citizens of the host country. According to the researchers, this mismatch between skills is likely to be the main reason for the 40% median wage gap between refugees and host countries.
It is also noted that, unlike employment rates, underemployment does not improve significantly over time when language, sector continuity, education, and labor market barriers are taken into account, indicating the presence of structural barriers that require targeted intervention.
According to UNHCR, reducing gaps in employment and productivity will lead to significant macroeconomic benefits: if average national targets are achieved, this could increase annual GDP growth by up to 0.7 percentage points in some countries, especially those with large refugee populations and significant productivity gaps.
Among other findings of the study, adults aged 50-64 are about 10 percentage points less likely to be employed than those who are younger. Men are 7 percentage points more likely to be employed than women. Having a vocational diploma increases the probability of employment by about 5 percentage points compared to those with only a secondary education. However, higher degrees provide only limited additional benefits—about 10 percentage points overall—with little difference between bachelor’s and master’s degrees.
Living with young children under the age of 6 reduces the probability of employment by 11 percentage points, which is consistent with other studies that identify childcare constraints as a significant barrier.
At the same time, living alone increases the probability of employment by 8 percentage points.
Surprisingly, living with elderly people (65+) is associated with a 6 percentage point increase in the probability of employment, suggesting that most elderly people may not require intensive care from household members, but rather provide support with household chores.
In terms of language, respondents who report at least some knowledge of the local language are 13 percentage points more likely to be employed than those who do not know it at all or have only minimal knowledge. It is noteworthy that a higher level of language proficiency does not seem to provide additional advantages, which means that the types of jobs available to Ukrainian refugees (mostly low-skilled) may not require a high level of language proficiency.
Finally, the study notes that there is a clear link between the likelihood of finding employment and the time elapsed since arrival. Although there is no significant difference between arrivals in the last six months and those in the last year, the probability of employment increases by 10 percentage points relative to the baseline for those who arrived 1–2 years ago, by 14 percentage points for those who arrived 2–3 years ago, and by 20 percentage points for those who arrived more than three years ago.
According to updated UNHCR data, the number of Ukrainian refugees in Europe as of January 16, 2026, was estimated at 5.349 million (5.311 million as of December 11), and 5.898 million (5.860 million) worldwide.
In Ukraine itself, according to the latest UN data for the end of 2025, there were 3.7 million internally displaced persons (IDPs), compared to 3.340 million in July and 3.76 million in April.

The Kametstal plant, part of the Metinvest mining and metallurgical group (Kamensk, Dnipropetrovsk region), has certified B500SP and B500B grade rebar for supply to Lithuania.
According to the company, Metinvest’s steel products are conquering EU construction sites.
At the same time, it is noted that at the end of 2025, Kametstal’s rebar took a new step in European geography: from the “green light” on the Romanian market for B500C class profiles in October to the official certification of B500SP and B500B classes for Lithuania in December.
“The certification process for B500SP and B500B grade rebar with a nominal diameter of 8 to 32 mm, produced on the 400/200 rolling mill, has been successfully completed. As a result, certificates have been obtained that enable Kametstal to supply its products to customers in Lithuania,” the company said in a statement.
It is noted that the certification was preceded by intensive preparation and coordinated work by a team of specialists from Kametstal and the management company of the Metinvest Group. An offline audit, during which an experienced expert, Valdemaras Gauronskis, director of the Construction Products Certification Center (Statybos produkcijos sertifikavimo centras – SPSC), visited Kametstal, took place at the end of October. Based on the results of the production inspection, a positive decision was made regarding the compliance of the specified grades of reinforcing steel with the Lithuanian standard.
Kametstal is part of the Metinvest Group.
CERTIFICATE, EUROPE, EXPORT, LITHUANIA, reinforcement, Каметсталь

Kernel, one of Ukraine’s largest agricultural holdings, has discussed new opportunities for development in the EU market and agreed on prospects for deepening its partnership with Spanish sunflower and olive oil supplier Aceites Abril, the agricultural holding’s press service reported on Facebook.
It is noted that the topic of the meeting in Orense (Spain) was the expansion of vegetable oil supplies to Europe and the adaptation of logistics. The parties discussed the range, potential volumes, and practical solutions to ensure the stability and predictability of exports.
“We talked about specific things: logistics, supply flexibility, and opportunities to expand the range for the EU. It is important for us to build predictable, long-term models of cooperation. We continue to develop partnerships in the EU, focusing on supply stability, effective commercial solutions, and long-term mutually beneficial cooperation,” said Andriy Paladiy, director of oil and protein trading at the agricultural holding, whose words are quoted in the report.
Founded in 1962, Spanish company Aceites Abril S.A. is one of Spain’s leading family-owned vegetable oil producers. It specializes in the production of Extra Virgin and Virgin olive oil, as well as sunflower, soybean, and grape seed oil. The company owns a factory in the industrial zone of San Sibao das Vinhas and its own logistics terminal in the port of Vigo, which exports products to more than 60 countries around the world. The company is consistently among the ten largest players in the industry in Spain.
Before the war, the Kernel agricultural holding company ranked first in the world in sunflower oil production (about 7% of global production) and exports (about 12%). It is one of the largest producers and sellers of bottled oil in Ukraine. It is also involved in the cultivation and sale of agricultural products.