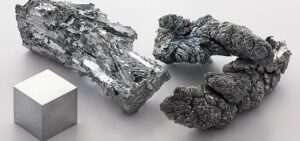
The volume of zinc and zinc products supplied to Ukraine in January-July 2025 decreased by 0.5% to $33.204 million (in July – $7.452 million). Zinc exports for the first seven months of the year reached $707,000 (in July – $87,000), while in January-July 2024 they amounted to $120,000.
Pure metallic zinc is used to recover precious metals, protect steel from corrosion, and for other purposes.

In January-July 2025, Ukraine reduced imports of nickel and nickel products by 26.7% compared to the same period in 2024, to $12.446 million (in July – $1.875 million), while exports of nickel and nickel products amounted to $746,000 (in July – $139,000) compared to $423,000 for the first seven months of 2024.
Nickel is used in the production of stainless steel and for nickel plating. Nickel is also used in the production of batteries, in powder metallurgy, and in chemical reagents.

In January-July of this year, Ukrainian enterprises increased imports of copper and copper products in value terms by 29.1% compared to the same period last year, to $109.984 million.
According to statistics released by the State Customs Service of Ukraine on Tuesday, exports of copper and copper products during the period increased by 12.7% to $55.437 million.
In July, copper imports amounted to $16.821 million, while exports amounted to $9.357 million.
Copper is widely used in electrical engineering, pipe manufacturing, alloy production, medicine, and other industries.

In January-July of this year, Ukraine increased imports of coke and semi-coke in physical terms by 6.1% compared to the same period last year, to 364,669 thousand tons from 343,678 thousand tons.
According to statistics released by the State Customs Service (SCS) on Tuesday, imports of coke in monetary terms decreased by 2.8% during this period, to $121.049 million.
It was mainly imported from Poland (89.62% of supplies in monetary terms), Indonesia (7.90%), and the Czech Republic (2.45%).
During the period in question, Ukraine exported 3 tons of coke worth $2,000 to Albania.
As reported, Metinvest suspended the operations of the Pokrovsk Coal Group in January this year due to changes in the situation on the front line, electricity shortages, and the deterioration of the security situation.
Last year, Ukraine increased its imports of coke and semi-coke in physical terms by 2.01 times compared to 2023, to 661,487 thousand tons, importing it mainly from Poland (84.76% of supplies in monetary terms), Colombia (7.74%), and Hungary (2.69%). In monetary terms, imports increased by 81.9% to $235.475 million.
In 2024, the country exported 1,601 thousand tons of coke worth $368 thousand to Moldova (99.18%) and Latvia (0.82%), while in January, March, October, and November 2024, there were no exports, and in 2023, exports amounted to 3,383 tons worth $787 thousand.

According to statistics from the State Customs Service, imports of trucks to Ukraine in July 2025 amounted to $85.07 million, which is 6% less than in June of this year.
According to the published data, most trucks were imported last month from Poland – $20.1 million (26.4% more), France – $14.4 million (5.4% less), and the US – $5.7 million (16.4% less).
In total, over the first seven months of this year, trucks worth $563.6 million were imported into Ukraine, including $117.5 million from Poland, $89.5 million from France, and $87 million from the US.
Imports of trucks from all other countries in January-July amounted to $269.5 million.
At the same time, according to statistics, Ukraine exported only $3.7 million worth of trucks in seven months, mainly to Turkey (53% of exports of such vehicles), Romania (42.6%), and Moldova (22%).
As reported, in 2024, imports of trucks to Ukraine increased by 30% compared to 2023, to $947.84 million, with the largest share coming from Poland (almost 20%).

The volume of passenger car imports to Ukraine, including cargo-passenger vans and racing cars (UKT ZED code 8703), increased by 21.1% in July this year compared to June 2025, to $608.443 million.
According to statistics released by the State Customs Service of Ukraine, China ($147.87 million) became the leader among the three largest suppliers of cars to Ukraine last month, while in June it was not among the top three.
The United States ranked second, with imports from this country increasing by 30% to $106.82 million, and Germany ranked third, with imports of passenger cars increasing slightly to $87.14 million.
Japan did not make it into the top three last month, with imports worth $62.53 million in June.
At the same time, in January-July of this year, passenger cars worth more than $3.16 billion were imported into Ukraine, with Germany ($561.47 million), the US ($525.16 million), and China ($407.67 million) being the largest suppliers.
Imports of passenger cars from other countries during the same period amounted to $1.67 billion.
At the same time, in January-July, Ukraine exported only $4.54 million worth of such vehicles, in particular to the UAE (29.3%), the Czech Republic (15.7%), and Poland (11%).
According to the State Customs Service, passenger cars accounted for 6.89% of total imports to Ukraine in January-July and 0.02% of exports.
As reported, in 2024, passenger cars worth $4.385 billion were imported into Ukraine, 8% more than a year earlier, and $10.1 million worth were exported (2.7 times less).
The top three countries from which the most cars were imported last year were the United States ($817.9 million, an increase of 13.2% compared to 2023), Germany ($682.16 million, an increase of 5.8%), and Japan ($495.71 million, a decrease of 12%).