Georgia in January-October 2022 increased wine exports by 6% compared to the same period last year to $200.8 million, the National Statistics Service said.
According to published reports, during the 10 months $12.3 million was exported to Poland, $10.5 million to China, $9.14 million to Ukraine, $8.15 million to Kazakhstan, $4.7 million to Belarus, $4.46 million to USA, $3.8 million to Latvia, $2.9 million to Germany, $1.8 million to Lithuania. 64% of all exports were delivered to Russia, making up $128.9 million.
Georgia exported $234 million (107 million bottles) worth of wine in 2021, which is a historical record for the country. The National Wine Agency believes that this year’s supplies to foreign markets could be no less. The agency says one of the achievements of the industry is the increased supply of Georgian products to such a famous country as France. That country for the 10 months of 2022 purchased Georgian wine at almost $ 985 thousand. This result looks modest compared with the volume of supplies to traditional markets for Georgia, but it is twice as much as the record number of shipments to France in 2018.

Ukraine in January-September 2022 reduced imports of nickel and products from it by 44.4% compared to January-September 2021 – to $49.3 million (in September – $4.664 million), aluminum and products from it – by 30, 8%, to $239.539 million ($32.357 million). At the same time, it reduced the import of lead and products from it by 65.1% – to $2.395 million ($146 thousand). Imports of tin and products from it fell by 8% – to $2.789 million ($322 thousand), and imports of zinc and zinc products also decreased – by 58.5%, to $28.225 million ($2.090 million).
Exports of aluminum and products from it for the first nine months of 2022 decreased by 36.4% compared to January-September 2021 – to $75.861 million (in September – $9.406 million), lead and products from it by 67.2% – to $9.370 million ($0.684 million), nickel and products – by 69.2%, to $1.079 million ($0.141 million).

Ukrainian enterprises in January-September this year reduced imports of copper and copper products in value terms by 62% compared to the same period last year – to $47.502 million.
According to customs statistics released by the State Customs Service of Ukraine, exports of copper and copper products over the specified period decreased by 55.5% to $71.226 million.
In September, copper and copper products were imported in the amount of $5.758 million, exported – in the amount of $7.083 million.
In addition, Ukraine in January-September 2022 reduced imports of nickel and products from it by 44.4% compared to January-September 2021 – to $49.3 million (in September – $4.664 million), aluminum and products from it – by 30.8%, to $239.539 million ($32.357 million). At the same time, it reduced the import of lead and products from it by 65.1% – to $2.395 million ($146 thousand). The import of tin and products from it fell by 8% – to $2.789 million ($322 thousand), and the import of zinc and zinc products – by 58.5%, up to $28.225 million ($2.090 million).
Exports of aluminum and products from it for the first nine months of 2022 decreased by 36.4% compared to January-September 2021 – to $75.861 million (in September – $9.406 million), lead and products from it by 67.2% – to $9.370 million ($0.684 million), nickel and products – by 69.2%, to $1.079 million ($0.141 million).
Export of zinc for the reporting period amounted to $1.302 million (no export was carried out in August-September), while in January-September 2021 it was $132 thousand. Export of tin and products in January-September 2022 amounted to $420 thousand (in September – $24 thousand) against $87 thousand for January-September-2021.
As reported, Ukraine in 2021 increased copper imports in value terms by 59% compared to 2020 – up to $183.161 million, exports of copper and copper products over the specified period increased by 2.4 times compared to 2020 – up to $206.390 million.
In 2021, Ukraine also increased the import of nickel and products from it by 45.8% compared to 2020 – up to $119.154 million, aluminum and products from it – by 30.2%, to $511.190 million. At the same time, it reduced the import of lead and products of it by 7.8% – up to $8.512 million, increased imports of tin and products from it by 75.2%, up to $4.977 million, and also increased zinc and zinc products – by 62.9%, up to $93.635 million.
Exports of aluminum and products from it in 2021 increased by 53.9% – to $169.094 million, lead and products from it by 52.8% – to $38.229 million, nickel and products – by 55%, to $4.856 million.
Zinc exports last year amounted to $550 thousand, while in 2020 it was $69 thousand (an increase of eight times). Export of tin and products in 2021 amounted to $346,000 against $117,000 in 2020.

Ukraine in January-September this year reduced imports of aluminum ores and concentrate (bauxite) in physical terms by 75.6% compared to the same period last year – up to 945.311 thousand tons.
According to statistics released by the State Customs Service (STS), during this period, bauxite imports in monetary terms decreased by 72.8% to $48.106 million.
At the same time, imports were carried out mainly from Guinea (58.97% of supplies in monetary terms), Brazil (27.22%) and Ghana (7.49%).
Ukraine in January-September 2022 did not re-export bauxite.
As reported, Ukraine in 2021 reduced the import of aluminum ores and concentrate (bauxite) in physical terms by 0.1% compared to 2020, to 5 million 114.227 thousand tons. Bauxite imports in monetary terms increased by 4.2% to $236.638 million.
At the same time, imports were carried out mainly from Guinea (59.33% of supplies in monetary terms), Brazil (21.33%) and Ghana (16.8%).
Ukraine in 2021 re-exported bauxite in the amount of 277 tons worth $70 thousand to Belarus (48.57%), Poland (40%) and the Russian Federation (7.14%), while in 2020 255 tons of bauxite were re-exported to Poland for $41 thousand
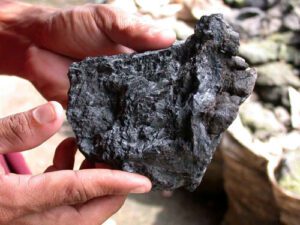
Bauxites are aluminum ores used as a raw material for the production of alumina, and from it – aluminium. They are also used as fluxes in ferrous metallurgy.
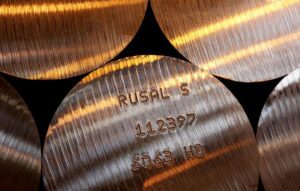
Bauxites are imported to Ukraine by the Nikolaev Alumina Refinery (NGZ), which was affiliated with the United Company (OK) Russian Aluminum (RusAl, RF) before the war. Alumina is produced from bauxite.
RusAl also previously owned a stake in Zaporozhye Aluminum Plant (ZALK) in Ukraine, which stopped producing primary aluminum and alumina.

Ukraine in January-September this year reduced imports of nickel ores and concentrate in kind by 63.9% compared to the same period last year – up to 328.936 thousand tons.
According to statistics released by the State Customs Service (STS), in monetary terms, imports of nickel ores decreased by 65.7% to $14.796 million.
At the same time, the import was carried out from Guatemala (100% of deliveries in terms of money).
For the nine months of 2022, as in January-September 2021, Ukraine did not export and re-export these products.
As reported, Ukraine in 2021 reduced the import of nickel ores and concentrate in physical terms by 20.6% compared to 2020 – to 1 million 235.533 thousand tons. In monetary terms, imports of nickel ores decreased by 22.2% to $58.929 million. Imports were carried out from Guatemala (100% of deliveries in monetary terms).
Last year, Ukraine did not export and re-export these products.
Nickel ore is imported to Ukraine by the Pobuzhsky ferronickel plant (PFC, part of the Solway group).
PFC processes about 1.2 million tons of ore per year.

Ukraine in January-September this year reduced the import of manganese ore and concentrate in kind by 54.1% compared to the same period last year – up to 135.044 thousand tons.
According to statistics published by the State Customs Service (STS), in monetary terms, imports of manganese ore and concentrate for the specified period decreased by 50.7% – to $17.972 million.
In August-September, manganese ore was practically not imported.
At the same time, for the nine months of 2022, imports were carried out from Ghana (99.86% of supplies in monetary terms) and Belgium (0.1%) and Brazil (0.02%).
For nine months of 2022, Ukraine did not supply manganese ore and concentrate for export.
As reported, Ukraine in 2021 reduced the import of manganese ore and concentrate in physical terms by 26.8% compared to 2020, to 425.279 thousand tons. In monetary terms, imports of manganese ore and concentrate over the specified period decreased by 29.6% to $53.917 million. At the same time, the main imports were from Ghana (99.87% of supplies in monetary terms), Brazil (0.07%) and Belgium ( 0.05%).
Last year, Ukraine supplied 770 tons of manganese ore and concentrate to Poland (94.38%) and the Russian Federation (5.62%) in the amount of $89 thousand, while in 2020 it exported 69.303 thousand tons of manganese ore and concentrate to $10.819 million
In Ukraine, manganese ore is mined and enriched by Pokrovsky (formerly Ordzhonikidzevsky) and Marganets mining and processing plants (both – Dnepropetrovsk region).
The consumers of manganese ore are ferroalloy enterprises.