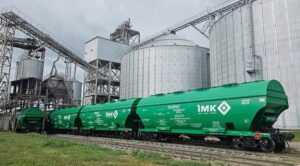
In 2024, the elevators of the IMC agricultural holding shipped a record volume of grain – more than 1.1 million tons, in January-June 2025, they completed the shipment of the remaining crop of 2024 and carried out preparatory work for the reception of the new harvest, the press service of the agricultural holding reported on Facebook.
The agricultural holding noted that in recent years, several projects have been implemented at IMC elevators as part of the Smart Green Strategy, in particular in the use of green energy.
“Four of IMC’s elevators have already been equipped with solar panels, and installation is underway at two more facilities, which will cover the demand for electricity from green sources for office buildings and critical infrastructure of elevators. This also contributes to the energy independence of the elevators and the continuous production process despite possible interruptions in electricity supply due to Russian shelling of Ukraine’s energy system,” IMC said.
In addition, two of IMC’s elevators and three grain drying complexes have installed heat generators that run on sunflower pellets and grain waste, which allows replacing natural gas with biofuel for the grain drying process.
“This year’s scheduled repairs at IMC’s elevators are already at the completion stage. We are currently disinfecting the production facilities. IMC elevators are ready to accept the new winter wheat harvest,” emphasized Andriy Havrylenko, Deputy CEO of IMC for Grain Storage and Processing.
IMC Agro Holding is an integrated group of companies operating in Sumy, Poltava and Chernihiv regions (north and center of Ukraine) in the crop production, elevators and warehouses segments. The land bank is 116 thousand hectares, storage capacity is 554 thousand tons, with a harvest of 864 thousand tons in 2024.
IMC ended 2024 with a net profit of $54.54 million against a net loss of $21.03 million in 2023. Revenue increased by 52% to $211.29 million, gross profit quadrupled to $109.10 million, and normalized EBITDA increased 25 times to $86.11 million.

As of June 20, Ukraine had exported 40.04 million tons of grains and legumes since the beginning of the 2024-2025 marketing year (July-June), of which 1.668 million tons were shipped since the beginning of the current month,
according to the press service of the Ministry of Agrarian Policy and Food, citing data from the State Customs Service.
According to the report, as of June 21 last year, total shipments were estimated at 49.54 million tons, including 2.608 million tons in June.
At the same time, since the beginning of the current season, 15.566 million tons of wheat (18.123 million tons in 2023/2024 MY) have been exported, 2.314 million tons of barley (2.461 million tons), 10.8 thousand tons of rye (1.6 thousand tons), and 21.565 million tons of corn (28.416 million tons). (1.6 thousand tons), and corn – 21.565 million tons (28.416 million tons).
Total exports of Ukrainian flour since the beginning of the season as of June 20 are estimated at 68.7 thousand tons (in 2023/2024 MY – 96.7 thousand tons), including wheat flour – 61.2 thousand tons (91.3 thousand tons).
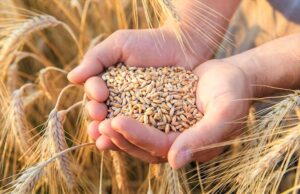
Farmers in three regions of Ukraine have begun harvesting early grains and legumes and have harvested 34,800 tons of grain from the new harvest from an area of 14,200 hectares, which is 28% less than a year earlier, according to the Ministry of Agrarian Policy and Food.
The ministry noted that in the Odesa, Kherson, and Mykolaiv regions, 33,900 tons of barley were harvested from an area of 13,600 hectares with a yield of 24.9 centners per hectare, and 900 tons of peas were harvested from 600 hectares with a yield of 15.2 centners per hectare.
According to the Ministry of Agrarian Policy and Food, the largest harvesting areas are expected in the Dnipropetrovsk, Kharkiv, Poltava, Vinnytsia, and Cherkasy regions, where the main work will begin in late June – early July.
The report states that this year, 1.398 million hectares are planted with barley in Ukraine, 210,400 hectares with peas, and early grains and legumes occupy a total of 11.1 million hectares.
As reported, the harvest in Ukraine in 2024 officially began on June 21, when farmers in the Vinnytsia, Dnipropetrovsk, Kirovohrad, Odesa, Mykolaiv, and Kherson regions harvested 48.3 thousand tons of grain from the new harvest, including 1.1 thousand tons of wheat with a yield of 22.0 cwt/ha, 39.9 thousand tons of barley with a yield of 29.8 cwt/ha, and 7.3 thousand tons of peas with a yield of 22.0 cwt/ha.

Ukrzaliznytsia plans to change average transportation speeds for grain cars starting June 16, according to Valery Tkachov, deputy director of the commercial department at Ukrzaliznytsia (UZ) Valery Tkachov during an online meeting with participants in the agricultural market.
He noted that for grain cars of the Center for Transport Logistics branch of JSC Ukrzaliznytsia on domestic and import transportation, the speed for car dispatch will be 111 km/day, for route trains — 258 km/day; for export transportation via land crossings — 144 km/day and 217 km/day, respectively; for export transportation to port stations — 189 km/day and 323 km/day, respectively.
Tkachov added that these transport speeds will be taken into account exclusively when calculating the cost of using Ukrzaliznytsia JSC wagons.
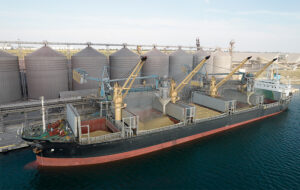
As of June 11, Ukraine had exported 39.256 million tons of grains and legumes since the beginning of the 2024-2025 marketing year (July-June), of which 884,000 tons were shipped since the beginning of the current month, according to the press service of the Ministry of Agrarian Policy and Food, citing data from the State Customs Service.
According to the report, as of June 12 last year, total shipments were estimated at 48.381 million tons, including 1.449 million tons in June.
At the same time, since the beginning of the current season, 15.184 million tons of wheat (17.839 million tons in 2023/2024 MY) have been exported, 2.312 million tons of barley (2.437 million tons), 10.8 thousand tons of rye (1.6 thousand tons), and 21.169 million tons of corn (27.57 million tons). (1.6 thousand tons), corn – 21.169 million tons (27.57 million tons).
Total exports of Ukrainian flour since the beginning of the season as of June 11 are estimated at 66.7 thousand tons (in 2023/24 MY – 94.6 thousand tons), including wheat flour – 62.3 thousand tons (89.3 thousand tons).
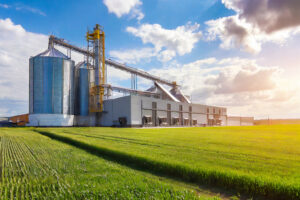
Two flour processing plants will be built in Ukraine in 2025 – flour will be produced in western Ukraine, and cereals in the Poltava region, according to an interview with Interfax-Ukraine by Rodion Rybchinsky, director of the Ukrainian Flour Millers Association.
“Currently, a plant for the production of hard wheat flour with a capacity of up to 150 tons per day is being built in western Ukraine, with further processing of pasta, and in the Poltava region, a cereal plant with a combined capacity of up to 100 tons per day is expected to be launched,” he said.
According to the head of the industry association, there are niches in the flour milling business that are worth paying attention to.
“When we talk about grain processing, we must remember that it is not just flour or cereals. There are also combined products: dry breakfasts, energy bars, starch, dry gluten, enzyme preparations based on grain processing products — a very wide range of processed products,” Rybchynsky emphasized, adding that the main priority in the construction of such a production facility is the availability of buyers.
According to him, the cost of building a mill or a cereal plant in Ukraine starts at $3 million, but there are examples of businesses in Ukraine with a higher price tag of $15 million. This amount includes the cost of equipment and buildings (fixed assets), excluding working capital, which can reach 50% of the project cost. After all, in order to launch an enterprise, it is necessary to purchase raw materials, actively enter the market, and anticipate marketing costs, etc.
Rybchinsky also does not rule out the prospect of building a number of flour mills on the Black Sea coast, following the example of Turkey.
“Uzbekistan and Egypt have followed the same path as the Turks. The Uzbeks buy Kazakh grain, grind it, and have become the main exporter of flour to Afghanistan, from where they have ousted Kazakhstan. Egypt buys Ukrainian and Russian grain and has become the leading supplier of flour to the African market, partially displacing both the Turks and the French. All this points to the existence of a state policy,” he stressed, adding that the first step towards such a development of processing in Ukraine should be the interest of the state.