
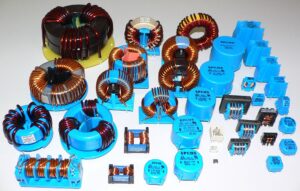
According to Experts.news, Ukraine increased its imports of transformers, inductors, and chokes by 49% in January–August 2026 compared to the same period last year—to $1.02 billion—with China accounting for nearly 88% of all shipments of these products, according to data from the State Customs Service.
Over the eight-month period, Ukraine imported $890 million worth of transformers, inductors, and chokes from China, accounting for 87.7% of total imports in this product category.
A year earlier, imports from China totaled $563.4 million, or 82.7% of Ukraine’s imports. Thus, over the course of the year, China not only significantly increased the volume of its exports but also raised its share of the Ukrainian market by approximately 5 percentage points.
Turkey and Germany remained other major suppliers. Turkey accounted for about 3% of imports, while a year earlier its share was 2.5%. Germany’s share, conversely, fell from 5.8% to 1.4%.
The growth rate of transformer equipment imports has been gradually slowing throughout 2026. In the first quarter, imports increased by 81% year-over-year; in the first half of the year, by 63%; and from January through August, growth stood at 49%.
In August 2026, Ukraine imported transformers, inductors, and chokes worth $115.7 million, which is 7.7% more than in August of last year.
The high volume of purchases of transformer equipment persists amid the need to restore and modernize Ukraine’s energy infrastructure.
In March 2026, the Cabinet of Ministers removed transformers from the list of goods that could be imported on preferential terms under agreements with the EU Secretariat. In May, the European Business Association appealed to First Deputy Prime Minister and Minister of Energy of Ukraine Denys Shmyhal with a proposal to temporarily exempt certain types of power transformers from import duties and VAT.
At the same time, Ukraine continues to export its own transformers and related electrical equipment. From January through August 2026, the value of these exports totaled nearly $24.8 million, compared to $19.9 million a year earlier. The main export markets were Germany, Poland, and Hungary.
By comparison: for the full year of 2025, Ukraine imported transformers, inductors, and chokes worth $1.12 billion, which was 88% higher than the 2024 figure. Imports from China rose 2.3-fold during that period—to $957.3 million.
Thus, in just the first eight months of 2026, the volume of Ukraine’s imports of these products approached the figure for the entire previous year, and China further solidified its status as a key supplier of transformer equipment to the Ukrainian market.
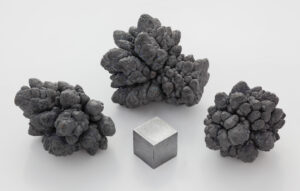
In January–August 2026, Ukraine reduced imports of lead and lead products by 77% compared to the same period last year, down to $1.282 million.
According to statistics released by the State Customs Service of Ukraine, imports of lead and lead products in August totaled $98,000.
Exports of lead and lead products in January–August of this year rose by 17.2% to $7.402 million, and in August, they totaled $1.416 million.
As previously reported, in 2025, Ukraine increased its imports of lead and lead products by a factor of 3.3 compared to 2024, reaching $7.801 million. Exports of lead and lead products in 2025 decreased by 17.8% to $9.377 million.
Lead is currently used primarily in the production of lead-acid batteries for the automotive industry. In addition, lead is used in the manufacture of bullets and certain alloys.
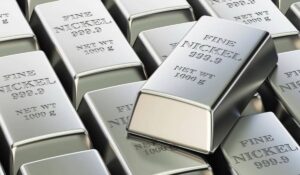
In January–August 2026, Ukraine increased imports of nickel and nickel products by 8.9% compared to the same period last year, reaching $15.811 million.
According to statistics released by the State Customs Service of Ukraine, nickel and nickel product imports totaled $1.967 million in August.
Exports of nickel and nickel products in January–August 2026 totaled $404,000, and in August, $34,000, compared to $746,000 for the first eight months of 2025.
As previously reported, Ukraine reduced imports of nickel and nickel products by 2.7% in 2025 compared to 2024, down to $26.011 million. Exports of nickel and nickel products totaled $1.420 million, compared to $602 thousand in 2024.
Nickel is used in the production of stainless steel and for nickel plating. It is also used in battery manufacturing, powder metallurgy, and chemical reagents.
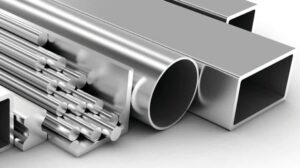
In January–August 2026, Ukraine increased imports of aluminum and aluminum products by 31.7% compared with the same period last year, reaching $453.439 million.
According to statistics released by the State Customs Service of Ukraine, aluminum and aluminum product imports totaled $64.792 million in August.
Exports of aluminum and aluminum products in January–August of this year rose by 25.3% compared to the same period last year, reaching $123.934 million; in August, they totaled $14.369 million.
As previously reported, in 2025 Ukraine increased imports of aluminum and aluminum products by 15.3% compared to 2024, reaching $514.098 million. Exports of aluminum and aluminum products in 2025 rose by 22.9% to $152.919 million.
Aluminum is widely used as a structural material. The main advantages of aluminum are its light weight, formability, corrosion resistance, high thermal conductivity, and the non-toxic nature of its compounds. In particular, these properties have made aluminum extremely popular in the production of cookware, aluminum foil in the food industry, and for packaging. The first three properties have made aluminum the primary raw material in the aviation and aerospace industries (though it has recently been displaced by composite materials, primarily carbon fiber). After construction and packaging production—aluminum cans and foil—the energy sector is the largest consumer of this metal.
For a more detailed overview of global aluminum production from 1970 to 2024, watch the video on the Experts Club YouTube channel.
ALUMINUM, EXPERTS CLUB, EXPORTS, IMPORTS, METALLURGY, UKRAINE

In January–August of this year, Ukrainian companies increased their imports of copper and copper products by 13.3% in monetary terms compared to the same period last year—to $139.044 million.
According to statistics released by the State Customs Service of Ukraine, exports of copper and copper products rose by 22.7% over the eight-month period, reaching $75.529 million.
In August, copper imports totaled $15.771 million, while exports totaled $9.646 million.
As previously reported, in 2025, Ukrainian companies increased imports of copper and copper products by 23.2% in monetary terms compared to 2024—to $173.453 million—while exports of copper and copper products rose by 17.7%—to $103.848 million.
Copper is widely used in electrical engineering, in the manufacture of pipes, for creating alloys, in medicine, and in other industries.
Previously, the Experts Club information and analytical center released a video on global copper production and leading producing countries – https://youtube.com/shorts/_h8iU50z8C0?si=a-XkgGEfeUxseQNa
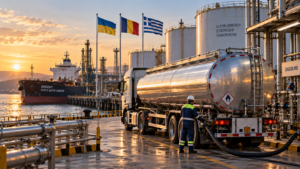
In August 2026, Ukraine significantly reduced purchases of motor gasoline from the southern direction: imports from Romania decreased by approximately one third, while those from Greece fell by 40%, according to calculations by the Experts Club analytical center and data from the A-95 Consulting Group.
Supplies of Romanian gasoline amounted to 23.4 thousand tonnes compared with 34 thousand tonnes in July.
Imports from Greece decreased to 15 thousand tonnes from 24.9 thousand tonnes a month earlier.
Thus, total supplies from the two countries decreased over the month from approximately 58.9 thousand to 38.4 thousand tonnes.
“The main reason for the significant drop in imports from the south was the price factor. In August, when the market was no longer threatened by a shortage, companies reduced purchases of more expensive fuel from Romania and Greece,” the A-95 Consulting Group reported.
A similar trend was also observed in the diesel fuel market.
At the same time, the bulk of Ukrainian gasoline imports continued to arrive from the northwestern direction. In August, Lithuania supplied 51.8 thousand tonnes of gasoline, while Poland supplied 40.1 thousand tonnes.
These two countries accounted for about 60% of total imports.
Overall, gasoline supplies from abroad in August amounted to 152 thousand tonnes, which is 7% less than a year earlier. Since the beginning of 2026, Ukraine has imported 1.12 million tonnes of gasoline — 16% more than in January-August 2025.
The decline in purchases from the southern direction shows that after supply stabilized, Ukrainian traders began more actively redistributing flows in favor of cheaper European sources.



