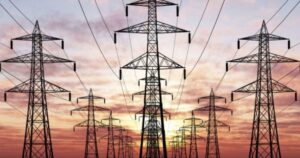
Electricity imports to Ukraine from June 8 to 14 rose by 63% compared to the previous week—to 100.6 thousand MWh, the DIXI Group analytical center reported on Tuesday, citing data from Energy Map.
“Compared to the previous week, imports increased across all sources,” the center noted.
At the same time, exports fell by 38% to 17.2 thousand MWh.
According to Energy Map, Hungary accounted for the largest share of imports last week—40,000 MWh, or 39.8%. Slovakia accounted for 27,900 MWh (27.7%), Romania – 23.5 thousand MWh (23.4%), Poland – 9.2 thousand MWh (9.1%), and Moldova – 0.03 thousand MWh (<0.1%).
The highest growth rates in imports were recorded from Moldova—a 2.5-fold increase. Imports from Slovakia and Hungary increased by 86% and 83%, respectively; from Romania—by 47%; and from Poland—by 5%.
Meanwhile, in the export structure, Hungary’s share amounted to 7.3 thousand MWh (42.6%), Romania’s share was 6.4 thousand MWh (37.3%), Moldova’s was 3.4 thousand MWh (19.9%), and Slovakia’s was 0.04 thousand MWh (0.2%).
Compared to the previous week, exports decreased by 36–89% in most directions. At the same time, supplies to Romania increased 2.8-fold. Electricity exports to Poland have not taken place since November 2025.

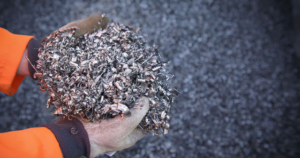
The value of Ukraine’s exports of insulated wires and cables (including fiber-optic cables) in January–May 2026 increased by 3.2% compared to the same period in 2025, reaching $612.9 million.
According to statistics from the State Customs Service (SCS), Germany remained the largest importer of Ukrainian products, as it was last year; shipments to Germany saw almost no growth, totaling $209.4 million, while its share of total exports of these products decreased slightly to 34.2%.
As in January–May 2025, the top three importers also included Hungary—$102 million (compared to $95.8 million last year)—and Poland—$97.9 million ($90.7 million).
According to statistics, exports of these products turned negative in May, declining by 6.6% compared to May 2025 and by 1% compared to April of this year, to $124.15 million.
At the same time, according to the State Customs Service, imports of wires and cables into Ukraine increased by 20.4% in January–May, reaching $220.8 million.
The largest suppliers of wires and cables to Ukraine were China ($75.2 million, or 26.8%), Hungary ($73.6 million, or 26.2%), and Poland ($37.1 million, or 13.2%), whereas last year imports from Hungary totaled $65.5 million, from China – $45.4 million, and from Poland – $33.3 million.
As reported, according to the State Customs Service, in 2025 Ukraine increased its exports of insulated wires and cables by 10.6% compared to 2024—to $1.41 billion—and imports by 24.3%—to $590.7 million.
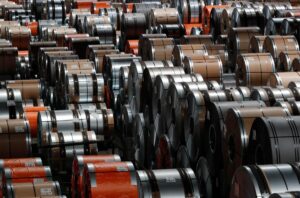
In January–May of this year, Ukrainian companies reduced their consumption of rolled metal products by 2.22% compared to the same period last year, down to 1,592.4 thousand metric tons.
According to a press release from the “Ukrmetallurgprom” association on Tuesday, 732.4 thousand metric tons were imported during this period, accounting for 45.99% of the domestic rolled steel consumption market.
According to “Ukrmetallurgprom,” in January–May 2026, Ukrainian steel companies produced 2.340 million metric tons of rolled steel (93.3% of the figure for the same period in 2025), of which, according to the State Customs Service of Ukraine, approximately 1.480 million metric tons—or 63.2%—were exported. In January–May 2025, the share of exports was 61.5% (1.541 million metric tons out of a total rolled steel production of 2.507 million metric tons).
The share of semi-finished products in export shipments in January–May 2026 was 41.22%, which is significantly higher than the figure for the first five months of 2025 (32.23%). The share of flat products in exports from January through May 2026 is virtually the same as in January through May 2025 (46.96% and 46.59%, respectively). The share of long products, however, is noticeably lower than the figure for January–May 2025 (11.82% in 2026 versus 20.18% in 2025).
The structure of imports in January–May 2026 is characterized by a marked dominance of flat-rolled products over structural steel (62.42% and 28.59%, respectively); however, in January–May 2025, the dominance of flat-rolled products over long products was significantly greater (76.83% and 21.23%, respectively).
“In January–May 2026, the domestic market capacity amounted to 1 million 592.4 thousand metric tons of rolled steel, of which 732.4 thousand metric tons, or 45.99%, consisted of imports. In January–May 2025, the domestic market capacity was 1,557.8 thousand metric tons, of which 591.8 thousand metric tons, or 37.99%, were imported. “Thus, in January–May 2026, the domestic market capacity decreased by 2.22% compared to January–May 2025, while the share of imports increased by 8%,” the press release states.
According to the State Customs Service, the main export markets for Ukrainian rolled metal in January–May 2026 were the European Union (78.6%), the rest of Europe (11.7%), and the CIS (6.9%).
Among importers of rolled metal in January–May 2026, other European countries ranked first (47.8%), followed by Asian countries (26.6%) and the EU-27 (16.0%).
As previously reported, Ukraine’s rolled metal market grew by 21.73% in 2025 compared to 2024, reaching 4 million 1.6 thousand metric tons. Imports totaled 1 million 603.6 thousand metric tons, accounting for 40.07% of domestic rolled metal consumption.
Ukraine’s rolled steel market in 2024 contracted by 6.26% compared to the previous year—to 3 million 288.4 thousand metric tons, while in 2023 it grew 2.19 times compared to 2022—to 3 million 505.6 thousand metric tons.
EXPORTS, IMPORTS, METALLURGY, rolled metal, UKRMETALLURGPROM
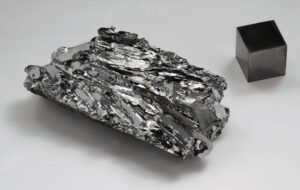
In January–May 2026, Ukraine reduced imports of zinc and zinc products by 34.2% compared to the same period last year, to $14.029 million.
In May, imports of zinc and zinc products amounted to $3.499 million.
Zinc exports for the first five months of 2026 totaled $466,000, while in January–May 2025 they were $523,000. In May, zinc exports amounted to $174,000.
As reported, in 2025 Ukraine reduced imports of zinc and zinc products by 9.6% compared to 2024—to $52.982 million. Zinc exports for the past year reached $1.234 million, compared to $563,000 a year earlier.
Pure metallic zinc is used to restore precious metals, protect steel from corrosion, and for other purposes.
In May 2026, the Export Credit Agency (ECA) supported exports by Ukrainian companies to the tune of 1.16 billion UAH.
According to the agency’s website, Ukrgasbank provided the largest volume of support in cooperation with partner banks, backing UAH 1.059 billion in exports.
The largest volume of supported exports came from enterprises in Kyiv (UAH 879.3 million) and Chernihiv (UAH 88.7 million) regions.
The main importing countries for products from Ukrainian manufacturers insured by ECA in May were the UAE (UAH 879.26 million), the Netherlands (UAH 154.19 million), Kazakhstan, and Kyrgyzstan—each with UAH 44.35 million.
In terms of sectoral structure, the largest shares were accounted for by milk processing and the production of butter and cheese, the cultivation of pome and stone fruits, the production of wallpaper, sawmilling and planing, and the production of industrial refrigeration and ventilation equipment.
ECA, EXPORTS, UAE, UKRGASBANK
In January–May 2026, Ukraine cut imports of lead and lead products by 71.9% compared to the same period last year, down to $958,000.
In May, imports of lead and lead products amounted to $199,000.
At the same time, exports of lead and lead products in January–May of this year increased by 4.9% compared to the same period last year—to $3.818 million. In May, $891,000 worth of lead was exported.
As reported, Ukraine increased imports of lead and lead products by 3.3 times in 2025, reaching $7.801 million. Exports of lead and lead products last year decreased by 17.8%, to $9.377 million.
Lead is currently used primarily in the production of lead-acid batteries for the automotive industry. In addition, lead is used in the manufacture of bullets and certain alloys.