
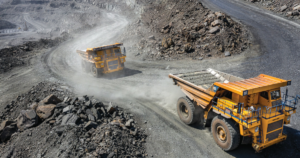
In January–September of this year, Ukraine’s mining companies reduced exports of iron ore raw materials (IORM) by 29.8% in volume terms compared to the same period last year—down to 16,948,958 metric tons from 24,145,038 metric tons.
According to statistics released by the State Customs Service (SCS), 1,174,008 thousand metric tons of iron ore were exported in September, 1,865,697 thousand metric tons in August, 1,875,428 thousand metric tons in July, in June—2,021,299 metric tons; in May—2,239,167 metric tons of raw materials; in April—2,163,837 metric tons; in March—2,300,467 metric tons; in February – 1,254,516 thousand metric tons, in January – 2,054,539 thousand metric tons.
Over the first nine months of 2026, foreign exchange earnings from mineral ore exports decreased by 29% to $1,286,304 million.
In addition, Ukraine imported 246 metric tons of raw materials worth $74,000 in January–September 2026, whereas in January–September 2025, it imported 107,000 metric tons worth $80,000.
As previously reported, Ukraine’s mining companies reduced ore exports in physical terms by 8% in 2025 compared to the previous year—to 30,995,363 metric tons from 33,699,722 metric tons, and foreign exchange earnings decreased by 16.6%—to $2 billion 337.765 million from $2 billion 803.223 million. Exports were primarily shipped to China (44.98% of shipments in monetary terms), Slovakia (17.15%), and Poland (16.09%).
In addition, in 2025, Ukraine imported $95,000 worth of raw materials totaling 130 metric tons from the Netherlands (46.32%), Italy (36.84%), and Norway (13.68%), whereas in the previous year it imported 2,042 metric tons worth $414,000
EXPORTS, IRON ORE, METALLURGY, mining and metallurgical complex, UKRAINE

The Ukrainian insulated wire and cable manufacturing sector continues to be one of the industrial segments with a significant trade surplus.
In January–September 2026, Ukraine exported these products worth $1.065 billion, while imports totaled $540.7 million. Thus, the trade surplus reached approximately $524.3 million.
Exports exceeded imports by nearly two to one, which stands in stark contrast to the overall structure of Ukraine’s foreign trade, where imports of goods have significantly exceeded exports in recent years.
However, the trend indicates a gradual narrowing of this surplus.
Exports of wires and cables over the nine-month period remained virtually unchanged compared to last year, while imports rose by 22.7%. According to estimates, imports in January–September 2025 totaled about $441 million, and the trade surplus was approximately $624 million.
Thus, over the year, the trade surplus in wires and cables decreased by approximately $100 million, or 16%.
The European Union remains Ukraine’s main export market. Germany, Poland, and Hungary alone purchased nearly $698 million worth of Ukrainian products, accounting for about two-thirds of total exports.
At the same time, the structure of imports is becoming more Asian-oriented. China increased its shipments by approximately 70%—to $157 million—and took first place among suppliers, ahead of Hungary and Poland.
As a result, a dual trend is emerging: Ukraine continues to be a major supplier of cable products to European industry, but at the same time is rapidly increasing its purchases of certain types of wires, cables, and electrical components from abroad.
By the end of 2025, exports of cable products totaled $1.41 billion, while imports amounted to $590.7 million, meaning the annual surplus exceeded $819 million.
The sustained significant trade surplus makes the production of wires and cables one of the most interesting examples of the Ukrainian manufacturing industry, which is deeply integrated into European production chains. That said, future trends will depend on the state of the European automotive industry, energy infrastructure development, and the ability of Ukrainian companies to maintain production amid the war.
Source: State Customs Service of Ukraine, foreign trade statistics for January–September 2026.
State Customs Service Statistics

From January through September 2026, Ukraine exported insulated wires and cables, including fiber-optic products, worth $1.065 billion, maintaining shipment volumes at virtually the same level as the same period last year.
According to data from the State Customs Service, Germany remains the largest market for Ukrainian cable products. Over the nine-month period, shipments to this country totaled $348.7 million, down 2.8% compared to January–September 2025.
Germany’s share of Ukraine’s total exports of wires and cables decreased by approximately 1 percentage point—to 32.7%—but the country continues to account for nearly one-third of the industry’s total export revenue.
Poland ranks second, with Ukraine supplying $177.1 million worth of products, compared to $168.1 million a year earlier. Thus, exports to Poland increased by approximately 5.4%.
Hungary retained its third position with purchases totaling about $172 million, virtually unchanged from last year’s figure of $172.3 million.
The three largest European markets—Germany, Poland, and Hungary—accounted for a total of nearly $698 million in January–September, or about 65.5% of Ukraine’s total exports of wires and cables.
In September, exports of these products totaled $122.7 million. Compared to September of last year, this figure decreased by 6.6%, but compared to August 2026, it increased by 26%.
The cable industry remains one of the most prominent export-oriented segments of Ukraine’s machine-building and component manufacturing sectors. A significant portion of the products is supplied to companies in the European automotive, electrical engineering, and industrial sectors.
For the full year 2025, Ukraine increased its exports of insulated wires and cables by 10.6%—to $1.41 billion. If shipment rates in the fourth quarter remain close to last year’s levels, the annual export volume in 2026 may also remain at around $1.4 billion.

Both directions of cross-border electricity trade increased during the period of October 5–11: imports rose by 6% compared to the previous week—to 13,100 MWh—while exports rose by 20%—to 176,400 MWh.
“Despite localized restrictions, Ukraine remained a net exporter throughout the week,” the DIXI Group analytical center reported on Tuesday, citing data from Energy Map.
As previously reported, since October 6, due to Russian attacks on energy infrastructure, power restriction schedules (PRS) for industry and businesses and hourly blackout schedules (HBS) for the general public have been in effect in some regions of Ukraine.
However, even amid localized restrictions, Ukraine remained a net exporter throughout the past week due to a power surplus in other regions. This situation was caused by the inability to transmit power to certain regions and cities because the enemy had damaged transmission grids, substations, and distribution lines—particularly near major cities.
According to Energy Map, Hungary accounted for the largest share of exports that week—84,900 MWh, or 48.1%. Moldova accounted for 56,600 MWh (32.1%), Romania for 33,100 MWh (18.7%), and Poland for 1,800 MWh (1.0%).
Exports to Hungary, Romania, and Moldova increased by 15%–26%, and exports to Poland increased eightfold, though the volumes remained insignificant. No electricity was sold to Slovakia. The average daily export volume for the week was 25.2 thousand MWh.
Hungary remained the main source of imports, accounting for 8.7 thousand MWh (66.6%). Romania accounted for 3.6 thousand MWh (27.6%), Poland for 0.7 thousand MWh (5.5%), and Moldova for 0.05 thousand MWh (0.4%).
Imports from Romania and Moldova increased by 70% and 124%, respectively, while those from Hungary and Poland decreased by 3% and 39%. There were no deliveries from Slovakia for five consecutive weeks. The average daily import volume was 1.9 thousand MWh.
As previously reported, the week before last, from September 28 to October 4, electricity exports rose by 75.6% compared to the previous week—to 147.0 thousand MWh, marking the highest weekly export volume since September 2025.

European Union countries remain the largest destination for Ukrainian rolled metal products: in January–September 2026, the EU accounted for 82.2% of Ukraine’s exports of metallurgical products.
According to data from the State Customs Service of Ukraine, another 9.2% of shipments went to other European countries, and 6.7% went to CIS countries.
In total, Ukrainian steel mills exported approximately 2.277 million metric tons of rolled steel over the nine-month period, which accounted for 61.1% of the country’s total production.
At the same time, the geography of Ukrainian imports differs significantly from the structure of exports.
The largest source of steel product shipments to Ukraine was other European countries outside the EU, which accounted for 48.8% of imports.
Asian countries ranked second with a 26.6% share, while the EU-27 ranked third with 17%.
In total, Ukraine imported 1.276 million metric tons of rolled metal products from January through September.
Source: “Ukrmetallurgprom,” State Customs Service of Ukraine.

The Moldovan government will discuss with Ukrainian officials the possibility of signing a long-term contract for the supply of natural gas, Moldovan Prime Minister Vasile Tofan said on the eve of his visit to Kyiv.
“Until now, there has been a moratorium on gas exports from Ukraine. Very recently, an initiative was launched to lift this moratorium, as Ukraine also needs budget revenue. Indeed, the country has a certain surplus of gas. It is produced in two regions: Poltava and Ivano-Frankivsk. The volumes available for export are not very large. I’ve heard figures of around 500 million cubic meters of gas, which is roughly the amount we’ll need during the gas year on the regulated market,” said Tofan, as quoted by the state agency “Moldpres.”
According to him, this issue will be discussed during his visit to Kyiv, which is planned for the near future.
The prime minister expects Kyiv to offer Chisinau a competitive price for gas if a long-term contract—for 3 to 5 years—is signed. “We need to understand that Ukraine will sell this gas at market price. The cost can be reduced through an agreement that provides for a longer purchase term. If we buy gas for immediate consumption, we pay the market price or a price close to it. However, Ukrainian gas could be cheaper because our transportation costs will be lower. If we manage to negotiate the terms and conclude an agreement for a longer purchase period—three, four, or five years—by offering them a purchase guarantee, then the price could indeed be lower,” Tofan noted.
On October 7, the Ukrainian government approved the partial resumption of natural gas exports, which had been suspended in 2022. According to the decision of the Cabinet of Ministers of Ukraine, private producers will be able to export up to 15% of the volume of gas produced in the previous month. This mechanism will not apply to state-controlled companies and is intended to allow private producers to sell gas to foreign markets under regulated conditions.
As previously reported, Moldova entered another round of the energy crisis in August and September, causing domestic gas tariffs to rise 1.7-fold over two months; the country is also facing a sharp increase in the cost of imported petroleum products. A state of emergency in the energy sector has been in effect in Moldova since September 26.
In September, the Moldovan prime minister repeatedly stated the need to conclude long-term direct contracts for gas imports with producers, as opposed to exchange-traded forward contracts on the TTF hub in the Netherlands, under which gas has been supplied to Moldova since 2022. In particular, Tofan initiated negotiations on gas imports from the United States, Qatar, Azerbaijan, and Turkmenistan. He also stated that Moldova plans to conclude direct contracts for gas supplies in 2027 from Romania, specifically from the Neptun Deep field in the Black Sea.



