

According to the European Union’s statistical office, in 2025, European Union countries imported 2.9 million metric tons of coffee worth a total of EUR 18.7 billion from non-EU countries.
In terms of volume, imports have increased only slightly over the past ten years (from 2.7 million metric tons in 2015), but in terms of value, they have risen significantly (from EUR8.6 billion), the report states.
Last year, the main coffee suppliers were Brazil (1.005 million metric tons, or 34% of the total volume) and Vietnam (587,500 metric tons, or 20%). EU countries also purchased coffee from Uganda (262,400 metric tons, 9%), Colombia (162,900 metric tons, 6%), and Honduras (136,500 metric tons, 5%).
Germany accounted for about one-third of imports, purchasing 1.01 million metric tons of coffee (34% of the total volume). Next were Italy (608,000 metric tons, 21%), Spain (281,600 metric tons, 10%), Belgium (269,200 metric tons, 9%), and the Netherlands (216,600 metric tons, 7%).
In 2025, the European Union produced over 2.2 million metric tons of coffee (including coffee substitutes and decaffeinated beverages). This is 12% more than in 2015 (2 million metric tons).
The leading producers were Germany (561,200 metric tons, or 25% of the total volume) and Italy (514,200 metric tons, 23%). They were followed, at a considerable distance, by Spain (211,900 metric tons, 10%), France (146,800 metric tons, 7%), Poland (134,800 metric tons, 6%), Sweden (79,400 metric tons, 4%), and Finland (39,000 metric tons, 2%). Collectively, these seven countries accounted for 77% of production.

In January–September 2026, Poland increased its diesel fuel shipments to Ukraine by 44% compared to the same period last year—to over 2 million metric tons, according to data from the A-95 Consulting Group and its analysis by the Experts Club think tank.
In September, 202,600 metric tons of diesel fuel were supplied from Poland, which is virtually the same as the September 2025 level of 202,000 metric tons.
Romania remained the second-largest supplier in September, with 156,700 metric tons, compared to 158,600 metric tons a year earlier. Supplies from Lithuania increased by 7% to 65.9 thousand metric tons.
At the same time, imports from Southern Europe fell significantly. Supplies from Greece dropped by 70% to 40.8 thousand metric tons, and from Turkey by 88% to 6.1 thousand metric tons.
Overall, the volume of imports from southern Europe in September fell by 38%—to 220,000 metric tons—and its share of total imports decreased from 52% to 41%.
“Due to the war in Iran, southern European supplies are significantly more expensive this year than northern ones, and this is the main reason for the decline in volumes,” notes “A-95”.
Over the first nine months, diesel fuel imports from Lithuania rose by 33%—to over 560,000 metric tons. At the same time, shipments from Hungary fell by 49%—to 266,000 metric tons.
According to Serhiy Kuyun, director of the “A-95” Consulting Group, this shift in the geography of supplies indicates the Ukrainian fuel market’s continued adaptation to changes in price conditions and logistical risks.
The “A-95” Consulting Group conducts research on the motor fuel market, monitors prices and logistics, and analyzes the supply of resources to the Ukrainian market.
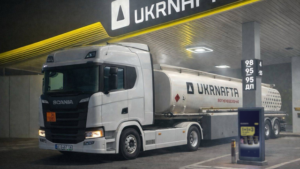
In September 2026, Ukrnafta became the largest importer of diesel fuel to Ukraine for the first time, supplying 105.3 thousand metric tons of the fuel, according to data from the A-95 Consulting Group and its analysis by the Experts Club.
The company’s import volume was 3.3 times higher than in September of last year.
OKKO took second place among the largest importers with 57,500 metric tons, while UPG came in third with 47,000 metric tons.
The top five also included AT Energo Trade with 44,000 metric tons and WOG with 42,500 metric tons.
Next came ZPEK with 29,400 metric tons, “Paid” with 28,900 metric tons, D.Trading with 26,500 metric tons, “Martin Trade” with 18,100 metric tons, and “Gaztrim” with 12,000 metric tons.
Among the largest players, the ZPEK Group showed the most significant growth compared to last year. Over the first nine months of 2026, its imports rose by 228% and approached 250,000 metric tons.
Total diesel fuel imports into Ukraine in September amounted to 537,000 metric tons, which is 21% less than a year earlier.
According to Serhiy Kuyun, director of the A-95 Consulting Group, changes among the largest importers are occurring against the backdrop of logistics transformation, high volatility in global prices, and the need for companies to establish more stable supply channels.
“The fuel market continues to face unprecedented challenges caused by Russian attacks. Importers are actively developing new logistics channels and expanding their vehicle fleets,” notes “A-95”.
The A-95 consulting group has been researching the Ukrainian motor fuel market for over two decades and monitors prices, supplies, and market infrastructure.

The Polish oil refining group ORLEN S.A. supplied 1.3 million metric tons of diesel fuel to Ukraine from January through September 2026, which is 33% more than during the same period in 2025, according to data from the A-95 Consulting Group.
Compared to the first nine months of 2024, shipments increased by 68%.
ORLEN remains the largest corporate supplier of diesel fuel to the Ukrainian market.
In September, the company shipped a total of approximately 110,000 metric tons of diesel fuel from refineries in Poland and Lithuania. This is 30% less than in September of last year.
The decline in monthly shipments occurred against the backdrop of an overall reduction in Ukrainian diesel fuel imports. In September, the volume of imports amounted to 537,000 metric tons, which is 21% less than a year earlier.
At the same time, Poland retained its status as the largest supplier of diesel fuel to Ukraine. Over the first nine months, shipments from Poland rose by 44% and exceeded 2 million metric tons.
According to Serhiy Kuyun, director of the “A-95” Consulting Group, the role of the northern route in supplying the Ukrainian market has strengthened due to the higher cost of shipments from Southern Europe.
“A-95” notes that due to the significant rise in the price of Southern European supplies, Ukrainian companies are increasingly turning to supplies from Poland and Lithuania.
The “A-95” Consulting Group specializes in research and monitoring of the Ukrainian petroleum products market. The company’s director is Serhiy Kuyun.

In September 2026, Ukraine imported 537,000 metric tons of diesel fuel, which is 21% less than in the same month of 2025 and 9% lower than in August, according to data from the A-95 Consulting Group.
Since the beginning of the year, diesel fuel imports have reached 4.7 million metric tons, which is 3% higher than the January–September figure from last year.
The main feature of September was unusually weak demand. A-95 attributes this, in particular, to massive attacks on industrial enterprises, as well as to problems with the export of agricultural products from the new harvest, including disruptions in maritime logistics.
“We do not yet have precise data, but there are all signs that retail sales of diesel fuel have also declined due to record prices caused by unprecedented global market rates,” note analysts at “A-95”.
The decline in demand is also confirmed by supply trends in the third quarter. During this period, approximately 1.7 million metric tons of diesel fuel were imported into Ukraine, which is about 10% less than a year earlier.
According to Serhiy Kuyun, director of the A-95 Consulting Group, the Ukrainian fuel market continues to operate amid unprecedented logistical and pricing challenges related to the war.
“The fuel market continues to face unprecedented difficulties caused by Russian attacks. Importers are actively developing new logistics channels and expanding their fleets, particularly of gasoline tankers,” the company notes.
The “A-95” consulting group specializes in research on the Ukrainian petroleum products market, price monitoring, logistics, and resource supply for the fuel market. Its director is Serhiy Kuyun.

According to Experts.news, gasoline imports to Ukraine in September 2026 totaled 145,000 metric tons, which is 5% less than in August but 3% higher than in September of last year, the A-95 Consulting Group reported based on the results of a special study.
From January through September, Ukraine imported 1.26 million metric tons of gasoline—15% more than during the same period in 2025.
“The decline in gasoline supplies in September occurred against the backdrop of a seasonal drop in consumption. Demand was also weighed down by this year’s record-high retail prices, which prompted car owners to conserve fuel,” the A-95 Consulting Group reported.
Lithuania remained the largest source of gasoline supplies in September, accounting for 46,400 metric tons, or 32% of the total volume. Compared to August, supplies fell by 10.4%.
Poland ranked second with 36,800 metric tons, or 25% of Ukraine’s imports. A month earlier, 40,100 metric tons were supplied from that country.
Thus, the combined share of Lithuania and Poland in September fell from 60% to 57%. Supplies from the largest supplier—the ORLEN Group—from these two countries decreased from 78,800 to 67,800 metric tons. Despite the decline, ORLEN accounted for about 47% of all Ukrainian gasoline imports.
At the same time, the geography of supplies changed. Imports from Germany fell by 25% compared to August—to 13,600 metric tons. Of this volume, 8,300 metric tons, or 61%, were imported by the UPG network.
At the same time, the share of southern supplies increased. Gasoline shipments from Romania rose by 29%—from 23.4 thousand to 30.1 thousand metric tons. As a result, Romania moved into third place among supplier countries and accounted for over 20% of September’s imports.
Supplies from Greece, on the other hand, fell by 28%—from 15,000 to 10,800 metric tons. Imports from Moldova more than doubled—from 1,900 to 4,100 metric tons.
Thus, despite the decline in total imports in September, shipments remain higher than last year’s level, and in the first nine months of 2026, Ukraine imported 15% more gasoline than in the same period a year earlier.
Source: A-95 Consulting Group.



