
Canada ranked first in terms of the balance of positive and negative attitudes among Ukrainians among Ukraine’s 50 largest trading partners, while China, which leads in trade turnover, received the lowest indicator, and attitudes toward Poland deteriorated significantly, according to the results of a study by Active Group and the Experts Club information and analytical center.
According to the published ranking, the balance of positive and negative assessments of Canada amounted to plus 73.8 percentage points. It was followed by Sweden – plus 70.6 p.p., the Netherlands – 69.7 p.p., Finland and Norway – 69.3 p.p. each, France – 69.1 p.p., Italy – 67.1 p.p., Lithuania – 65.9 p.p., Switzerland and the United Kingdom – 65.6 p.p. each.
This indicator is the difference between the shares of positive and negative responses. In particular, 76.3% of respondents have a positive attitude toward Canada, 2.5% have a negative attitude, and 19.2% have a neutral attitude.
The worst balance was recorded for China – minus 25.4 p.p.: 18.2% of respondents assess it positively, 43.6% negatively, and 33.9% neutrally. India also has a negative indicator – minus 14.3 p.p., Hungary – minus 12.7 p.p., and Lebanon – minus 9.2 p.p.
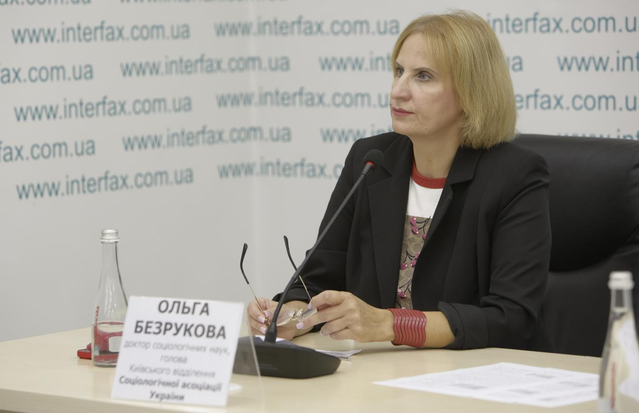
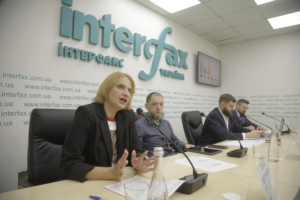
Doctor of Sociological Sciences and head of the Kyiv branch of the Sociological Association of Ukraine Olga Bezrukova called China an illustrative example of the gap between the scale of economic interaction and the country’s public image.
“We saw that China is Ukraine’s largest economic partner in terms of total trade turnover, but this is in no way converted into a positive public image. This shows that Ukrainian citizens clearly distinguish between the pragmatism of economic interaction and the overall assessment of a state. Economic dependence and interaction do not equal public sympathy for this country,” she emphasized at a press conference at the Interfax-Ukraine agency on Tuesday.
One of the most noticeable changes was the deterioration in attitudes toward Poland. While in March 2026 the balance of assessments stood at plus 41.7 p.p., in August positive and negative responses were practically equal, with a slight predominance of negative ones. A positive attitude was expressed by 34.6% of respondents, a negative one by 37%, and a neutral one by 25.4%.
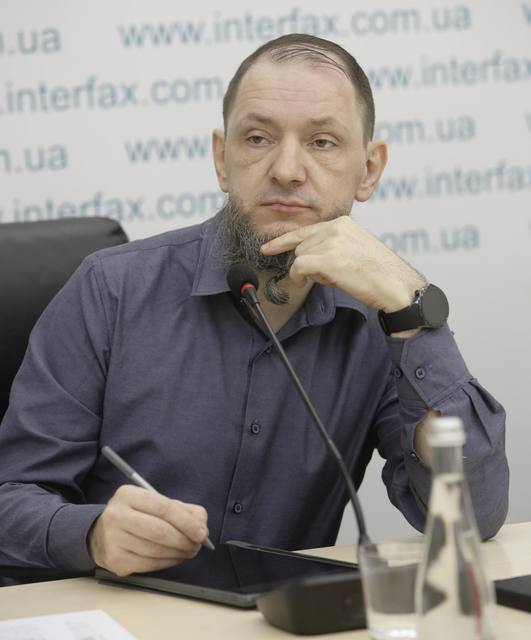
“At the beginning of the invasion, Poland was perceived almost as the main partner. We asked about the rapprochement between Ukraine and Poland, political and economic, even about uniting into some kind of common union, and we saw enormous positive results. But here we see: Poland seemingly still remains a key partner, but the idea of unification has already been forgotten, and we see stable negativity,” said Active Group founder Andriy Yeremenko.
He linked the deterioration in assessments to the position of part of the Polish authorities, which he considers anti-Ukrainian.
At the same time, the balance of attitudes toward Hungary improved from minus 33.6 p.p. in March to minus 12.7 p.p. in August, although negative assessments still prevail. For the United States, the indicator rose from plus 19.4 to plus 38.4 p.p. Some 55% of respondents have a positive attitude toward the United States, 16.6% a negative attitude, and 25.6% a neutral attitude.
When asked who contributes most to achieving peace in Ukraine, 44.6% of respondents named European Union countries, 25.2% the United States, 23.3% the United Kingdom, 4.1% China, 1.8% India, and 1% Brazil. Regarding priority development of trade and economic relations, 69.9% chose EU countries and the United Kingdom, 11.9% the United States, and 8.4% China.

According to Bezrukova, assessments of the U.S. role in achieving peace remained relatively stable throughout the three waves of the study.
“General sympathy toward a country and an assessment of its functionality at the international level are related but not identical things. Images of countries are multidimensional. A person may change their emotional attitude toward a state but continue to recognize its international weight,” the sociologist explained.
Another model, she said, is demonstrated by India: 48.3% of respondents express a neutral attitude toward it, but among formed assessments negative ones prevail – 31.5% versus 17.2% positive.
The economic indicators were presented by Experts Club founder, deputy director of the Interfax-Ukraine agency and PhD in Economics Maksym Urakin. According to State Customs Service data cited by him, in the first half of 2026 Ukraine’s trade turnover amounted to $70.3 billion, exports to $21 billion, and imports to $49.3 billion. The negative balance of trade in goods reached $28.3 billion.
“If we compare this with the first half of 2025, there was also an imbalance then, but now exports have increased by approximately 5%, while imports have risen by almost 30%. That is, the deficit increased by more than $10 billion over the year. Therefore, it is very important for us to analyze our main partners,” he emphasized.
According to the materials presented, trade turnover with China in January-June amounted to about $14.68 billion. Ukraine exported $778 million worth of goods to China and imported $13.90 billion, forming a deficit of approximately $13.12 billion. Poland remained the largest buyer of Ukrainian goods, with a volume of $2.38 billion. Türkiye ranked second among export markets with $1.78 billion, and Italy third with $1.28 billion.
In terms of total trade volume, China is followed by Poland – $7.05 billion, Türkiye – $4.90 billion, Germany – $4.48 billion, and the United States – $3.07 billion. Yeremenko highlighted Türkiye as an example of a combination of significant trade turnover and predominantly positive perception: 52.3% of respondents have a favorable attitude toward it, while 7.4% have a negative attitude.
Urakin separately drew attention to partners with which trade provides Ukraine with a positive balance. In the first half of the year, the largest was with Spain – $578.1 million, Egypt – $527.1 million, and Moldova – $467.2 million. They were followed by Algeria – $309.2 million, the Netherlands – $221.5 million, and Lebanon – $220.5 million. Libya, Tunisia, Iraq, and Yemen also entered the top ten.
At the same time, neutral attitudes prevail toward a number of these partners. Egypt is assessed neutrally by 61.3% of respondents, Algeria by 65.8%, and Tunisia by 67.3%. Participants in the press conference linked this to insufficient awareness among Ukrainians about these countries and emphasized the need for more active economic and public diplomacy.

“It is necessary to develop not only general awareness better. First of all, business associations, the Ministry of Economy and the Ministry of Foreign Affairs need to work to develop bilateral relations and improve the balance. In conditions where Ukraine already lacks financing and we live, essentially, at the expense of external borrowing, cooperation should be expanded with countries where we can have a positive balance,” said Active Group director Oleksandr Pozniy.
Urakin recommended that embassies accredited in Ukraine ensure full communication in the Ukrainian language, openness to the media, and regular reporting on the results of cooperation.
“The first recommendation is to regularly show concrete deeds, concrete actions, the presence here of foundations, embassies, teams, diplomats in the humanitarian sphere and in science. Second, to be open to questions and requests from the media and the public. We also need to use our sociology to draw conclusions and cement our relations, primarily trade relations,” he added.
This is the third wave of the study; the previous ones were conducted in August 2025 and March 2026. The survey was conducted in August 2026 using self-completed online questionnaires in the SunFlowerSociology panel. A total of 800 Ukrainian citizens aged 18 and over were surveyed. According to the organizers, the sample is representative by age, gender and region, and the stated maximum theoretical statistical margin of error at a 95% confidence level is 3.5%.
ACTIVE GROUP, CANADA, CHINA, EXPERTS CLUB, POLAND, PUBLIC OPINION, TRADE, UKRAINE, UNITED STATES
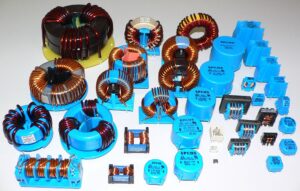
According to Experts.news, Ukraine increased its imports of transformers, inductors, and chokes by 49% in January–August 2026 compared to the same period last year—to $1.02 billion—with China accounting for nearly 88% of all shipments of these products, according to data from the State Customs Service.
Over the eight-month period, Ukraine imported $890 million worth of transformers, inductors, and chokes from China, accounting for 87.7% of total imports in this product category.
A year earlier, imports from China totaled $563.4 million, or 82.7% of Ukraine’s imports. Thus, over the course of the year, China not only significantly increased the volume of its exports but also raised its share of the Ukrainian market by approximately 5 percentage points.
Turkey and Germany remained other major suppliers. Turkey accounted for about 3% of imports, while a year earlier its share was 2.5%. Germany’s share, conversely, fell from 5.8% to 1.4%.
The growth rate of transformer equipment imports has been gradually slowing throughout 2026. In the first quarter, imports increased by 81% year-over-year; in the first half of the year, by 63%; and from January through August, growth stood at 49%.
In August 2026, Ukraine imported transformers, inductors, and chokes worth $115.7 million, which is 7.7% more than in August of last year.
The high volume of purchases of transformer equipment persists amid the need to restore and modernize Ukraine’s energy infrastructure.
In March 2026, the Cabinet of Ministers removed transformers from the list of goods that could be imported on preferential terms under agreements with the EU Secretariat. In May, the European Business Association appealed to First Deputy Prime Minister and Minister of Energy of Ukraine Denys Shmyhal with a proposal to temporarily exempt certain types of power transformers from import duties and VAT.
At the same time, Ukraine continues to export its own transformers and related electrical equipment. From January through August 2026, the value of these exports totaled nearly $24.8 million, compared to $19.9 million a year earlier. The main export markets were Germany, Poland, and Hungary.
By comparison: for the full year of 2025, Ukraine imported transformers, inductors, and chokes worth $1.12 billion, which was 88% higher than the 2024 figure. Imports from China rose 2.3-fold during that period—to $957.3 million.
Thus, in just the first eight months of 2026, the volume of Ukraine’s imports of these products approached the figure for the entire previous year, and China further solidified its status as a key supplier of transformer equipment to the Ukrainian market.

The Perfect Group plans to launch its own apartment renovation program for homebuyers in October 2026 and intends to import some of the finishing materials for the program directly from China.
The “7 KVARTAL” residential complex will serve as the pilot project, Perfect Group CEO Oleksiy Koval said in an interview with Interfax-Ukraine. The company is also discussing with banks the possibility of offering loans for apartment renovations.
One of the reasons for launching the program was the sharp rise in the cost of construction work and a shortage of renovation crews. According to the developer’s estimates, labor costs today can account for half the cost of renovations or even exceed the cost of materials.
To reduce costs, Perfect Group has reviewed offers from building materials manufacturers in China and is already arranging its first shipments.
In particular, the company intends to use HPL-like panels, which eliminate the need for some traditional processes such as plastering, wall preparation, painting, or wallpapering. According to the developer’s calculations, this solution should reduce renovation time and costs.
The company is also considering importing other construction products from China, including certain types of rebar and facade solutions. At the same time, Perfect Group believes it is more appropriate to source tiles, laminate flooring, and interior doors from Ukrainian manufacturers.
The group’s in-house production is currently focused primarily on aluminum and metal-plastic windows. Looking ahead, the company also does not rule out launching the production of cabinetry.
Perfect Group has been operating in the Ukrainian real estate market since 1991.

China has updated its defense mobilization legislation, strengthening requirements for industry, technology companies and civilian infrastructure to be prepared to operate for defense needs, the Experts Club information and analytical center reports.
The revised National Defense Mobilization Law was adopted on August 28, 2026, and will take effect on October 1. The document contains 14 chapters and 82 articles, compared with 72 articles in the 2010 version, and provides more detailed mechanisms for shifting the state, economy and society from peacetime to wartime conditions.
One of the key changes is the stronger role assigned to data and technology within the mobilization system. Enterprises given mobilization assignments must reserve not only equipment, materials and components, but also technologies, data and software. Authorities are also required to assess the resilience of production and supply chains, the availability of resources and companies’ ability to rapidly expand production of necessary goods.
Following a mobilization decision, designated companies may be required to fulfill military procurement contracts, switch production to required items or increase output. Suppliers of critical resources would be expected to give priority to defense-related tasks.
China’s industrial capacity makes these mechanisms particularly significant. In 2025, the country’s GDP reached approximately CNY 140.19 trillion, while manufacturing value added amounted to about CNY 34.7 trillion. China produced 34.8 million vehicles, 484.3 billion integrated circuits and 773,000 industrial robots. Research and development expenditure reached CNY 3.93 trillion.
At the same time, adoption of the law does not in itself mean that China has declared mobilization or decided to go to war. Many of the mechanisms were already present in the previous legislation. The reform primarily modernizes the system technologically, clarifies preparedness procedures and potentially reduces the time between a political decision and the industrial implementation of defense tasks.
China’s official defense budget for 2026 stands at CNY 1.94 trillion. According to SIPRI estimates, Chinese military expenditure reached approximately $336 billion in 2025, marking the 31st consecutive year of growth.
For the global economy, China’s increased mobilization readiness matters because of its central role in the production of electronics, batteries, machinery, ships and industrial equipment. In a crisis scenario, changes in supply priorities could affect international supply chains and the availability of components.
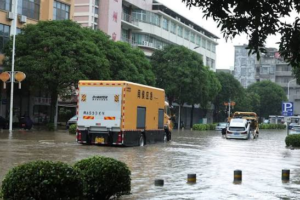
The Consulate General of Ukraine in Shanghai has warned Ukrainian citizens of large-scale flooding in Fujian Province in southeastern China, caused by heavy downpours resulting from Typhoon Saudel.
According to the diplomatic mission, intense rainfall has led to flooding in the region. Ukrainians staying in Fujian Province are advised to continuously monitor announcements from local authorities and weather forecasts and to avoid flooded areas, riverbanks and mountainous terrain.
The Consulate also urges people not to attempt to cross flooded roads and to comply with the instructions of local authorities if an evacuation is announced.
In China, the number for calling the police is 110, emergency medical services — 120, and the fire and rescue service — 119.
Ukrainian citizens who find themselves in an emergency due to the natural disaster are asked to contact the hotline of the Consulate General of Ukraine in Shanghai at +86 138 1631 8830.
Fujian is located on the coast of the Taiwan Strait and is regularly affected by tropical cyclones and typhoons, which can cause heavy rainfall, flooding and landslides during the summer-autumn season.
Original source: Consulate General of Ukraine in Shanghai
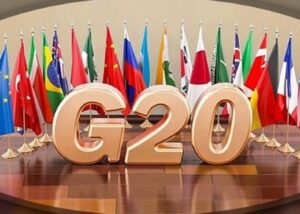
China was the only G20 country that did not support a number of provisions in the final document of the meeting of finance ministers and central bank governors of the “Group of Twenty,” held August 31–September 1, 2026, in Asheville, North Carolina.
As a result, instead of a joint communiqué agreed upon by all participants, the United States, as G20 chair, issued a chair’s statement. The official document from the U.S. Department of the Treasury states that it was endorsed by all G20 members present, except for China, which opposed four sections.
One of the main points of contention was the issue of global trade imbalances. The text, supported by the other countries, calls on nations to abandon non-market policies and practices that exacerbate imbalances. Countries with excessive and persistent external trade surpluses are urged to eliminate factors that constrain domestic consumption and create excessive dependence of economic growth on exports.
U.S. Treasury Secretary Scott Bessent stated after the meeting that China was the only dissenting participant. He called China’s current account surplus the largest and “unsustainable” and stated that a non-market economic model that constantly increases the supply of cheap export goods cannot be sustainable.
China also did not support provisions to expand the International Monetary Fund’s role in monitoring global economic imbalances. The other G20 members advocated for strengthening the IMF’s analysis, including an assessment of non-market policies, the factors driving external trade imbalances, and their impact on other economies.
Another point of contention was the Strait of Hormuz. The G20 statement expressed concern over ongoing disruptions to energy trade and emphasized the need for free, safe, and predictable shipping through the Strait of Hormuz and other key maritime routes. China opposed the entire relevant section of the document.
In addition, Beijing disagreed with the section concerning sovereign debt restructuring and the continued application of the G20’s Comprehensive Framework for Addressing the Debt Problems of Developing Countries. An official document from the U.S. Treasury Department explicitly states that China objected to paragraphs 4, 10, 11, and 13 of the statement.
Despite the lack of full consensus, the remaining 19 G20 members supported the approach to reducing global imbalances. Reuters notes that the issue has effectively turned into a debate over China’s export model, industrial subsidies, and the growing supply of Chinese products to global markets.
These disagreements come amid growing concerns from the U.S., the EU, and several other major economies regarding China’s manufacturing capacity and its expanding trade surplus. Western nations fear that a glut of Chinese industrial goods could intensify pressure on local manufacturers and increase dependence on specific supply chains.
The meeting in Asheville marked the second gathering of G20 finance ministers and central bank governors under the U.S. presidency in 2026. Key topics included economic growth, global imbalances, public debt, digital assets, financial literacy, and the state of the global financial system.
The G20 currently comprises 19 countries: Argentina, Australia, Brazil, the United Kingdom, Germany, India, Indonesia, Italy, Canada, China, Mexico, Russia, Saudi Arabia, the United States, Turkey, France, South Africa, South Korea, and Japan.
In addition, the European Union and the African Union are full members of the G20. Thus, following the African Union’s accession in 2023, the G20 effectively comprises 21 members—19 countries and two regional organizations.



