

OKKO maintained its leadership among the largest importers of automotive gasoline into Ukraine, importing 51,000 metric tons of fuel in September 2026, according to data from a special study by the A-95 Consulting Group and calculations by the Experts Club analytical center.
Thus, OKKO accounted for about 35% of total gasoline imports in September, which amounted to 145,000 metric tons.
From January through September, the company imported 375,000 metric tons of gasoline—about 30% of the total volume of shipments to Ukraine since the beginning of the year, which reached 1.26 million metric tons.
Ukrnafta took second place among importers in September with a volume of 19,500 metric tons. WOG recorded virtually the same figure—19,000 metric tons.
UPG imported 15,900 metric tons of gasoline. Thus, the four largest companies—OKKO, Ukrnafta, WOG, and UPG—accounted for a total of 105,400 metric tons, or nearly 73% of all gasoline imports into the country for the month.
Next came BRSM-Nafta with 5,300 metric tons, Avantage with 3,400 metric tons, BVS and SOCAR with 2,600 metric tons each, KLO with 2,300 metric tons, and VST with 1,900 metric tons. Other companies collectively imported 21,300 metric tons.
In September, gasoline imports into Ukraine fell by 5% compared to August—to 145,000 metric tons. The A-95 Consulting Group attributes the decline in supplies to a seasonal drop in consumption and this year’s record-high retail gasoline prices, which encouraged drivers to conserve fuel.
At the same time, compared to September 2025, imports rose by 3%, and over the first nine months of this year—by 15%, to 1.26 million metric tons.
Source: “A-95” Consulting Group.
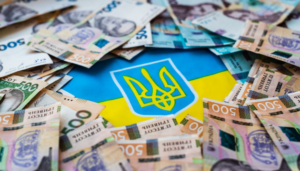
In September 2026, the State Customs Service of Ukraine transferred 75.2 billion hryvnia in customs duties to the state budget, which is 18.1 billion hryvnia more than in the same month last year.
According to Open4Business, citing data from the State Customs Service, revenues increased by 31.7% compared to September 2025, when 57.1 billion hryvnias were transferred to the budget.
The agency noted that actual revenue in September exceeded the indicative target set by the Ministry of Finance by 4.6 billion hryvnia.
One of the main factors driving the growth in revenue was the increase in the volume of taxable imports. In September 2026, this volume amounted to $7.3 billion, which is 23.7% more than a year earlier.
In particular, revenue from customs clearance of natural gas rose significantly—by 2.8 billion hryvnias—as did revenue from passenger cars (2.2 billion hryvnias), petroleum products (1.8 billion hryvnias), and coal (1.3 billion hryvnias).
Additional revenue was also generated by imports of telephones—by 0.9 billion UAH, power generators—by 0.7 billion UAH, and trucks—by 0.6 billion UAH.
At the same time, customs duty exemptions granted during customs clearance of goods in September totaled 25.3 billion UAH, which is 5.9 billion UAH, or 30.4%, more than in September of last year.
The largest amounts of exemptions were for defense-related goods—13.1 billion UAH, goods imported under free trade agreements—5.7 billion UAH, and energy equipment—2.4 billion UAH.
Thus, despite the increase in the volume of exemptions granted, the growth in imports and payments for certain major commodity groups allowed the State Customs Service to significantly increase revenues to the state budget.
The State Customs Service administers customs payments when goods cross Ukraine’s customs border. Customs revenues—primarily import VAT, excise taxes, and duties—are one of the largest sources of revenue for the state budget.

According to Experts.news, China’s foreign trade in goods reached 45.47 trillion yuan in 2025, up 3.8% from the previous year, said Ma Shengkun, China’s ambassador to Ukraine.
“In 2025, the total volume of China’s imports and exports of goods reached 45.47 trillion yuan, an increase of 3.8% year-over-year.
Imports totaled a record 18.48 trillion yuan,” the diplomat wrote in his column on the Interfax-Ukraine website.
According to him, China has remained the world’s second-largest import market for the 17th consecutive year and is the main trading partner for more than 160 countries and regions.
The ambassador also noted that in 2025, China’s imports from the least developed countries increased by 9%, while imports from Asia rose by 3.9%, from Latin America by 4.9%, and from Africa by 6%.
Ma Shengkun highlighted the growth of the high-tech segment of Chinese exports. According to the data he cited, exports of high-tech products reached 5.25 trillion yuan in 2025, an increase of 13.2%.
In particular, total exports of electric vehicles, photovoltaic products, and lithium batteries—referred to in China as the “new trio” of export goods—rose by 27.1%.
As previously reported, China remains Ukraine’s largest trading partner. According to a study by the Experts Club information and analytical center, Ukraine’s trade turnover with China reached $14.68 billion in the first half of 2026, including $13.9 billion in imports of Chinese goods and $778.4 million in exports of Ukrainian goods to China. China accounted for 21.9% of Ukraine’s total trade with its 50 largest trading partners.
According to the latest data from the State Customs Service of Ukraine, in January–August 2026, China retained its top position among suppliers of goods to Ukraine, with imports exceeding $19.6 billion. Ukraine’s total imports during this period amounted to nearly $66.3 billion, while exports totaled over $26.6 billion.
A joint study by Experts Club and Active Group published on September 18 also noted that China remains Ukraine’s largest trading partner; however, Ukrainian exports to the Chinese market lag significantly behind imports from China.
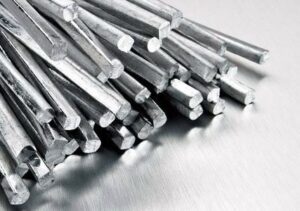
In January–August 2026, Ukraine increased its imports of tin and tin products 2.4-fold compared to the same period last year, reaching $6.352 million.
According to statistics released by the State Customs Service of Ukraine, imports of tin and tin products in August totaled $830,000.
Exports of tin and tin products in January–August 2026 totaled $740,000, and in August—$45,000, compared to $104,000 in January–August 2025.
As previously reported, Ukraine increased its imports of tin and tin products by 36.5% in 2025 compared to 2024, reaching $4.352 million. Exports of tin and tin products totaled $241,000, compared to $389,000 for the 12 months of 2024.
Tin is used primarily as a safe, non-toxic, corrosion-resistant coating, either in its pure form or in alloys with other metals. The main industrial applications of tin are in tinplate (tinned iron) for the manufacture of food packaging, in solders for electronics, in plumbing pipes, in bearing alloys, and in coatings made of tin and its alloys. The most important tin alloy is bronze (with copper).
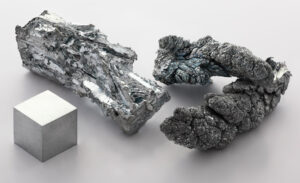
In January–August 2026, Ukraine reduced imports of zinc and zinc products by 35% compared to the same period last year, down to $24.126 million.
According to statistics released by the State Customs Service of Ukraine, imports of zinc and zinc products in August totaled $3.306 million.
Zinc exports for the eight-month period totaled $1,108 million; in August, they amounted to $189,000, compared to $888,000 in January–August 2025.
As previously reported, Ukraine reduced its imports of zinc and zinc products by 9.6% in 2025 compared to 2024, down to $52.982 million. Zinc exports last year reached $1.234 million, whereas in 2024 they totaled $563,000.
Pure metallic zinc is used to recover precious metals, protect steel from corrosion, and for other purposes.

Electricity exports from Ukraine on September 14–20 decreased by 17.3% compared to the previous week, to 109.3 thousand MWh, while imports increased by 12.2%—to 18.6 thousand MWh.
“Overall, electricity sales were nearly six times higher than purchases,” the DIXI Group analytical center reported on Wednesday, citing data from Energy Map.
As the center noted, weather conditions had the greatest impact on electricity trade during the reporting period. A cloudy start to the week, combined with a gradual seasonal decline in solar power generation, reduced the daytime power surplus, and the largest decline in exports occurred during daylight hours. At the same time, comfortable temperatures, mostly without precipitation, did not create peak loads on the power grid. Industrial consumption remained low due to Russian attacks.
According to Energy Map, Hungary accounted for the largest share of last week’s exports—53.8 thousand MWh, or 49.2%. Moldova accounted for 36,2 thousand MWh (33.1%), Romania for 19,0 thousand MWh (17.4%), and Poland for 0,3 thousand MWh (0.3%).
Compared to the previous week, exports declined across all destinations: to Poland by 72% (due to insignificant supply volumes), to Romania by 28%, to Moldova by 22%, and to Hungary by 8%. Exports to Slovakia remained at zero.
Hungary also remained the main source of imports, accounting for 8,900 MWh (47.8%). Poland accounted for 5,900 MWh (31.4%), Romania for 3,800 MWh (20.6%), and Moldova for 0.04 thousand MWh (0.2%).
As previously reported, in August 2026, electricity imports to Ukraine increased by 5% compared to July—to 184,000 MWh—while exports jumped by 63.8% to 380,900 MWh, marking the highest monthly export volume since September 2025. As a result, Ukraine maintained its status as a net exporter for the second consecutive month: sales exceeded purchases by nearly double.



