

On October 17, 2026, large-scale nationwide protests took place in France against the rising cost of living, increasing fuel prices, and cuts in funding for public services. According to the country’s Ministry of the Interior, approximately 550,000 people took part in the demonstrations, while organizers estimate the number of participants at 800,000, Reuters and the French newspaper Le Monde report.
A total of 110 demonstrations took place across the country. In Paris alone, according to Interior Minister Laurent Nuñez, approximately 110,000 people took to the streets. The protests also spread to Marseille, Lyon, Lille, Bordeaux, Toulouse, and other major cities.
The participants’ main demands included higher wages and pensions, measures to curb food and energy prices, increased funding for education and healthcare, and the preservation of social guarantees.
Trade unions, student organizations, representatives of farmers’ associations, transport sector workers, and activists from the “yellow vests” movement, which emerged in France in 2018 due to rising fuel prices, joined the demonstrations.
The current wave of protests began in September with student demonstrations against teacher shortages, the poor condition of educational institutions, and insufficient government funding for education. Subsequently, the demands expanded to include issues of purchasing power, social inequality, and the government’s economic policy.
Despite the predominantly peaceful nature of the demonstrations, clashes with police, vehicle arson, vandalism and looting of shops, and attacks on administrative buildings occurred in several cities.
In Paris, the most tense situation was observed near Place de la République, where some groups of rioters threw stones and pyrotechnic devices at police officers. Law enforcement officers used tear gas and water cannons. There were also reports of shops being looted and bank branches being damaged.
In Marseille, a group of protesters entered the city council building; in Lyon, a tourist office was set on fire; and in Limoges, a fire damaged the town hall building. Incidents involving damage to administrative buildings were also recorded in other cities.
According to preliminary data from the French Ministry of the Interior, police detained approximately 400 people. Authorities reported injuries among law enforcement officers and civilians. A separate investigation was launched following the serious injury of a minor participating in a protest in Saint-Étienne.
French President Emmanuel Macron condemned the violence and stated the need to hold those responsible accountable. Prime Minister Sébastien Lecornu emphasized that the government would not allow the unrest to be used to exert pressure on state institutions.
At the same time, protest organizers emphasize that the overwhelming majority of participants demonstrated peacefully and demanded a revision of the state’s socioeconomic policy.
The mass demonstrations are taking place against the backdrop of a difficult situation in France’s public finances. According to the draft state budget for 2027 presented on October 1, the government plans to reduce the deficit from a projected 5.4% of GDP in 2026 to 5% of GDP in 2027.
To achieve this goal, overall fiscal consolidation measures totaling €54 billion are envisaged, including €43 billion within the framework of the draft laws on the state budget and the financing of the social security system.
At the same time, the government forecasts a slowdown in France’s economic growth to 0.5% in 2026, with a possible acceleration to 1% in 2027. Public debt servicing costs could rise from €79.2 billion in 2026 to €91.2 billion the following year.
Trade unions fear that measures to limit public spending will increase the burden on households, primarily those with low and middle incomes.
The protests have already caused disruptions to urban public transport, the temporary closure of certain Paris Metro stations, and damage to commercial properties. A final assessment of the economic damage caused by the unrest has not yet been released.
The new wave of social discontent is increasing political tensions in France ahead of the 2027 presidential election and complicating discussions on fiscal policy. Further developments will depend, among other things, on negotiations between the government, trade unions, and representatives of the student movement.
France is the second-largest economy in the eurozone after Germany and one of Ukraine’s largest trade and economic partners in the European Union.

According to Interfax-Ukraine, Ukraine’s economy showed the first signs of emerging from a recession in the first half of 2026, however, the high foreign trade deficit, inflationary pressures, and the dependence of public finances on international aid remain key macroeconomic risks, according to the latest issue of “Economic Monitoring.”
As noted by Maksym Urakin, Ph.D. in Economics and founder of the Experts Club information and analytical center, after real GDP fell by 0.6% year-over-year in the first quarter, the economy returned to growth in April–June.
In the second quarter, Ukraine’s real GDP increased by 0.4% compared with the same period last year and by 0.3% compared with the previous quarter. At the same time, the National Bank’s forecast projected growth of the Ukrainian economy at only 1.3% for the full year of 2026.
“Positive factors in the first half of the year included the resumption of at least minimal GDP growth, the return of international reserves to above $50 billion, stability in the foreign exchange market, more consistent international financing, and the adaptability of Ukrainian businesses. The main risks remain the war, the state of the energy sector, high production costs, a labor shortage, weak commodity exports, and a growing trade imbalance. Ukraine has a significant supply of external liquidity, but it cannot replace domestic economic growth,” Urakin noted.
Consumer inflation slowed to 7.2% in June, while core inflation accelerated to 8.1%. The NBU’s discount rate remained at 15%.
At the same time, after four months of decline, Ukraine’s international reserves increased by 12.1% in June—to $51.27 billion. The NBU’s foreign exchange interventions remained substantial.
Foreign trade remains one of the main structural risks to the Ukrainian economy. From January through June 2026, merchandise imports totaled approximately $49.3 billion, while exports amounted to about $21 billion. Thus, the merchandise trade deficit reached approximately $28.3 billion.
Public finances also remain under significant strain. Revenues to the General Fund of the state budget for the first half of the year totaled nearly 1.9 trillion UAH, while expenditures amounted to approximately 2.23 trillion UAH.
Approximately 1.4 trillion UAH, or about 63% of all General Fund expenditures, was allocated to the security and defense sector. The volume of international grants totaled 569.6 billion hryvnia.
According to Urakin, one of the main objectives of economic policy should be to transform significant imports of equipment, international funding, and defense spending into a foundation for creating new domestic production capacity.
“The next phase of economic policy should consist not only of maintaining financial stability, but also of transforming imported equipment, international funds, and defense spending into new production assets. The foundation for long-term development should be energy self-sufficiency, the defense-industrial complex, agricultural processing, machine building, production localization, logistics, digital technologies, and exports of high-value-added products,” says the founder of Experts Club.
At the same time, the first half of the year revealed significant differences between the world’s largest economies and emerging markets.
The Chinese economy grew by 4.7% in the first six months of 2026, while India posted a growth rate of about 7.8% in April–June.
Turkey continued to combine economic growth with extremely high inflation. In the second quarter, its GDP increased by 2.3% year-over-year and by 1.1% compared to the previous quarter, while annual inflation in June remained near 32%.
Brazil showed more moderate growth: its GDP in the second quarter increased by 2% year-over-year and by 0.5% compared to the previous quarter. In the first half of the year, the country’s economy grew by 1.9%, and annual inflation in June slowed to 4.64%.
“Key emerging economies ended the first half of the year with very different growth patterns. China grew by 4.7%, but its second quarter was weaker than the first, and domestic consumption lags significantly behind industrial output and exports. India continues to grow by nearly 8%, driven by the size of its domestic market and investment. Turkey remains an example of how inflation exceeding 30% limits the quality of economic growth, while Brazil is showing more moderate growth with gradual control of inflation. For Ukraine, the main conclusion remains the same: long-term growth requires its own industrial, technological, and export base,” Urakin emphasized.
In his assessment, the first half of the year confirmed the viability of Ukraine’s macrofinancial stabilization model, but at the same time revealed its limitations.
“The return of GDP to modest growth and the replenishment of reserves are positive signs; however, the $28.3 billion merchandise trade deficit, high underlying inflationary pressures, and the budget’s dependence on external financing reveal the limits of this model. Only by developing its own production and export base will Ukraine be able to transition from an economy of wartime stabilization to a model of sustainable postwar growth,” concluded Maksym Urakin.
“Economic Monitoring” is a monthly analytical and statistical publication led by Maksym Urakin, Ph.D. in Economics. The publication analyzes the main macroeconomic indicators of Ukraine and the world’s leading economies, as well as trends in GDP, inflation, public finances, international reserves, foreign trade, and key risks to economic development.
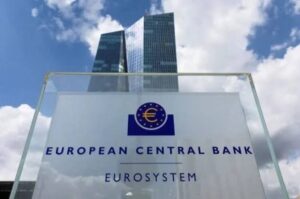
The energy shock caused by the U.S.-Iran war is likely to last longer than previously anticipated and extend beyond the oil sector, said Isabel Schnabel, a member of the Executive Board of the European Central Bank (ECB).
“At first, one might have assumed this was a short-term phenomenon, but, unfortunately, we have had to conclude that it is much more persistent,” Schnabel said at an event in Salsomaggiore Terme, Italy, on Thursday. “We’re not just talking about oil, but also diesel and natural gas.”
Her remarks reflect the ECB leadership’s ongoing concern about the consequences of the Middle East conflict, which has already caused inflation in the region to accelerate to a level significantly above the 2% target.
The year-over-year rate of consumer price inflation in the eurozone reached 3.2% in August, and analysts do not rule out it rising to 4% later this year, according to Bloomberg.
Expectations for further tightening of the ECB’s monetary policy have recently increased, with traders factoring in the likelihood of four interest rate hikes of 25 basis points (bp) by the regulator by the end of 2027.
“We’ve raised interest rates twice this year—first in June, then again in September—because we’re concerned about inflation. That’s why we had to act,” Schnabel said on Thursday.
The ECB raised all three key interest rates by 25 bps at its September meeting; the deposit rate now stands at 2.5% per annum.

According to Fixygen, the cryptocurrency market in the second half of September will be primarily influenced by decisions from major central banks, U.S. consumer demand and inflation data, as well as a large-scale quarterly expiration of Bitcoin and Ethereum options.
The main event will be the U.S. Federal Reserve meeting on September 15–16. The interest rate decision will be announced on September 16. This meeting is particularly important because, along with the decision, the Fed will publish updated economic forecasts and the so-called “dot plot”—the members’ expectations regarding the future trajectory of interest rates.
Anticipation surrounding the meeting has intensified sharply following the release of August inflation data. Consumer prices in the U.S. rose 0.4% month-over-month and 3.4% year-over-year, while core inflation stood at 0.3% month-over-month and 2.4% year-over-year. A day earlier, the Producer Price Index (PPI) showed a 0.4% monthly increase and a 5.4% annual increase.
Against this backdrop, the market sharply raised its expectations for a 25-basis-point rate hike by the Fed. Throughout September 11, futures markets priced in the probability of such a decision at approximately 82–87%, whereas just a few days before the CPI release, the Reuters consensus forecast among economists had predicted that the rate would remain at 3.50–3.75%.
For cryptocurrencies, a rate hike is traditionally an unfavorable factor: it increases the yield on dollar-denominated assets, raises the cost of borrowed capital, and reduces investors’ risk appetite. However, Bitcoin’s reaction will depend not only on the decision itself but also on the Fed’s comments. If the regulator signals that the September hike is a one-off, the market may react much more calmly than if it were seen as the start of a new tightening cycle.
U.S. retail sales data for August, which will also be released on September 16, will take on added significance ahead of the meeting. In July, this figure fell for the first time in nine months. A strong recovery in consumer spending could bolster the case for higher interest rates, while weak sales could somewhat ease investors’ concerns about further policy tightening. The release date is confirmed by the U.S. Census Bureau. (
On the same day, the BLS will release the August import and export price indices. Typically, this indicator has a much smaller impact on the market than the CPI; however, in the current situation, investors will be closely watching for signs that high prices for energy and imported goods are spilling over into U.S. inflation.
The next key factor will be the Bank of Japan. Its meeting is scheduled for September 17–18. According to a Reuters survey, the central bank is expected to raise its policy rate by 25 basis points—to 1.25%, the highest level in 31 years.
For Bitcoin, the Bank of Japan’s decision is significant due to the carry trade mechanism. For many years, investors have borrowed cheap yen and invested them in more profitable and risky assets. Rising interest rates in Japan and a strengthening yen make such strategies less attractive and could lead to a reduction in leveraged positions in global markets, including cryptocurrencies. Fears of a unwinding of the yen carry trade have repeatedly been a source of heightened volatility in risky assets.
Another potential source of sharp fluctuations will be September 25, when a major quarterly expiration of cryptocurrency options takes place on Deribit. Based on calculations using exchange open interest as of September 9, approximately $14.4 billion in Bitcoin options and another roughly $1.8 billion in Ethereum options were outstanding as of that date. About 41.5% of the total open interest in Bitcoin options was concentrated in the September expiration.
An expiration date alone does not determine the market’s direction; however, such a large volume of contracts can increase short-term volatility. A study published in the September issue of *Finance Research Letters* also points to statistically significant intraday reversals in Bitcoin prices during option expiration periods, especially when large positions held by market makers are present.
On September 29, the market will receive the August JOLTS report on U.S. job openings. Following a strong August jobs report—which showed the U.S. economy added 162,000 jobs with an unemployment rate of 4.1%—the state of the labor market has become yet another argument for proponents of a more hawkish Fed policy. An unexpectedly high number of job openings could put pressure back on Bitcoin due to rising U.S. bond yields.
But the most important data following the Fed meeting will be released on September 30. The U.S. Bureau of Economic Analysis will simultaneously publish the third estimate of second-quarter GDP and data on Americans’ personal income and spending for August. This report contains the PCE price index—the primary inflation measure the Fed uses as a guide.
If the PCE shows rising inflationary pressure following the CPI and PPI, expectations for additional rate hikes by the end of the year could intensify. For Bitcoin, such a scenario would mean continued pressure from high bond yields and a strong dollar. Conversely, a weaker PCE could bring back market expectations that monetary tightening is coming to an end.
The situation is complicated by rising oil prices. The yield on 10-year U.S. Treasury bonds approached 5% on September 11—its highest level since 2023—as high oil prices intensified fears of a new wave of inflation.
In addition, on September 10, the European Central Bank raised its key rates by 25 basis points: the deposit rate will be 2.50% starting September 16. The ECB directly linked this decision to persistent inflationary pressures, particularly due to the conflict in the Middle East and rising energy prices.
Thus, the second half of September is shaping up to be a period of heightened macroeconomic risk for the crypto market. Over the next two weeks, investors will sequentially see the Fed’s decision, a possible rate hike by the Bank of Japan, a major quarterly expiration of crypto options, U.S. labor market data, and the key PCE inflation index.
In the base case scenario, the cost of global liquidity remains the key factor for Bitcoin. If the Fed and the Bank of Japan simultaneously tighten policy, and inflation in the U.S. remains high, pressure on risk assets may persist. However, if the Fed signals that rate hikes are nearing the end of the cycle, and the PCE shows a slowdown in price growth, the market may find a reason to rebound by the end of September.
The key indicator following each data release will be not only the figure itself but also the reaction of U.S. Treasury yields and the dollar: if they continue to rise, it will be more difficult for cryptocurrencies to regain ground, whereas a decline in yields and the dollar’s exchange rate could draw capital back into Bitcoin, Ethereum, and other risky assets.

Romania may set a goal of joining the eurozone in 2032, provided that public finances stabilize and the country meets the criteria for the monetary union, said Dragos Pislaru, the country’s acting minister of investment and European projects.
The statement was made in an interview with the Romanian television channel TVR Info. However, 2032 is not yet an officially approved date for Romania’s transition to the euro, but is viewed by Pislaru as a possible target.
According to the minister, the country’s top priority should be fiscal and budgetary consolidation and bringing public finances to a stable state by 2030.
“The goal is to put our finances in order by 2030. Therefore, I see an opportunity to align several objectives: fiscal and budgetary consolidation and the adoption of a coordinated national development plan for 2028–2034,” Pislaru stated.
He also emphasized the need for political stability, which would allow the government to consistently implement such a plan. Once Romania has achieved the necessary macroeconomic indicators, it will need to go through the phase of participating in the European Exchange Rate Mechanism II (ERM II).
“Romania could, say, join in 2030 plus two years, because two years must be spent in the waiting room. This is a monitoring period. The year 2032 could be an important target for joining the eurozone,” the minister noted.
Currently, Romania does not yet meet the key criteria for adopting the euro. According to the European Central Bank’s convergence report published in June 2026, the country is not participating in ERM II. To meet the exchange rate criterion, a country must remain in this mechanism for at least two years without significant fluctuations or devaluation of its currency against the euro.
Inflation also remains a significant problem. The 12-month average harmonized inflation rate in Romania as of May 2026 stood at 8.4%, while the reference level for joining the eurozone was 2.7%. The average long-term interest rate was 6.7%, compared to the maximum permissible level of 5.1% for this criterion.
In addition, Romania is continuing the process of reducing its excessive budget deficit. The EU has set a trajectory for Bucharest that should allow it to eliminate the excessive deficit by 2030. The European Commission projected that the deficit would be reduced to 6.2% of GDP in 2026 and 5.8% in 2027. Public debt, on the other hand, is projected to rise to 63.4% of GDP in 2027.
Thus, the scenario for adopting the euro in 2032 envisages a significant reduction in the budget deficit and inflation, stabilization of public debt, entry into ERM II, and at least a two-year stay in this mechanism before final accession to the eurozone.

Prices for housing in Turkey in July 2026 rose by an average of 23.3% in local currency compared to last year; however, high inflation completely offset this increase: in real terms, real estate prices fell by 6.6%, according to the July market review by the platforms Emlakjet and Endeksa. The data was published on August 14.
The average price per square meter of housing nationwide reached 41,700 Turkish lira, or approximately $871, while the average price of a property sold was 5.21 million lira, which corresponds to approximately $109,000.
At the same time, July saw the first small positive sign in short-term trends: prices rose by 1.9% in nominal terms over the month and by approximately 0.5% when adjusted for inflation. However, one month is not yet enough to speak of a sustained recovery in the real value of Turkish housing.
Ankara’s Prices Are Rising Faster Than Istanbul’s and Antalya’s
Among the 30 provinces with the highest number of transactions, the most notable growth was recorded in Ordu—32.4% over the year. This is the only province among those analyzed where growth was positive even after adjusting for inflation—about 0.4%.
Ankara ranks second with a nominal increase of 28.7%, although in real terms, housing in the capital became approximately 2.5% cheaper. Next are Kocaeli—up 28.5%, Denizli—27.1%, and Elazığ—26.9%.
In Istanbul, a square meter of housing cost an average of 65,100 liras in July, and the average price of a property was about 7.16 million liras, or $149,500.
In Antalya, one of the main markets for foreign buyers, the average price per square meter reached 55,500 lira, and the average price per property was about 6.1 million lira, or $127,500. In Izmir, the average price was about 54,000 lira per square meter and 6.48 million lira per property.
Muğla remains Turkey’s most expensive province, home to resort centers such as Bodrum and Marmaris. Here, the average price per square meter reached 87,200 lira, and the average price per property was 11.34 million lira, or nearly $237,000. This is more than double the national average.
Housing sales have fallen sharply
The rise in prices is occurring against the backdrop of a significant decline in the number of transactions. According to the Turkish Statistical Institute (TÜİK), statistics on residential and commercial real estate sales for July were published on August 13, 2026. A total of 123,603 residential properties were sold nationwide during the month, which is approximately 17% less than a year earlier.
Istanbul remained the largest market with 22,600 transactions, followed by Ankara with 9,640, Izmir—6,550, and Antalya—6,300.
At the same time, the sales breakdown sends mixed signals. The number of mortgage transactions rose by 23.7%, while sales of new homes fell by 8.6% and those of existing homes dropped by as much as 20.8%. This may indicate a gradual return to the market of some buyers who are able to take advantage of bank financing.
Thus, the rise in the value of Turkish real estate in lira remains, to a large extent, a consequence of inflation. For investors, it is more important to pay attention not only to nominal growth of 20–30%, but also to real price trends, exchange rates, and rental yields. As of the end of July, the average property in Turkey is nominally significantly more expensive than a year ago; however, its real value continues to decline.
Open4Business recently conducted a separate analysis of the composition of foreign buyers of Turkish real estate. As of June 2026, Russian citizens ranked first with 381 purchases, while Ukrainians acquired 170 properties and tied for second place with Iranian citizens. In total, foreigners purchased 2,015 residential properties in June. From January through June, foreign demand totaled 9,083 properties, down 9.2% from the previous year.
Ukrainians remain one of the largest groups of homebuyers in Turkey, even over the long term. In 2025, Ukrainian citizens purchased 1,541 properties and ranked third among foreign buyers, trailing only Russians and Iranians. Thus, the decline in real prices for Turkish housing is of direct interest to Ukrainian private investors, who continue to maintain an active presence in this market.



