
European Union countries and the United Kingdom remain the top foreign economic priority for Ukrainians: in August 2026, 69.9% of respondents noted the need to prioritize the development of trade and economic relations with these countries. This is evidenced by the results of the third wave of the study “Ukrainians’ Attitudes Toward Countries Around the World,” conducted by Active Group in collaboration with the Experts Club Information and Analytical Center, according to the Experts Club Information and Analytical Center.
At the same time, support for the European direction has declined compared to previous waves of the study. In August 2025, 82.8% of respondents cited EU countries and the United Kingdom; in March 2026, 81.1%; and in August, 69.9%. Thus, over the course of a year, the figure decreased by 12.9 percentage points.
The trend regarding the United States is even more pronounced. In August 2025, 58.8% of respondents supported prioritizing the development of trade and economic relations with the United States; in March 2026, this figure was 59.2%, while in August it stood at 11.9%.
In August 2026, 8.4% of respondents named China as a priority, compared to 35.4% in March and 26.7% in August of the previous year. At the same time, China remains one of Ukraine’s most important trading partners, highlighting the discrepancy between the actual structure of foreign trade and public perceptions of the desired directions for its development.
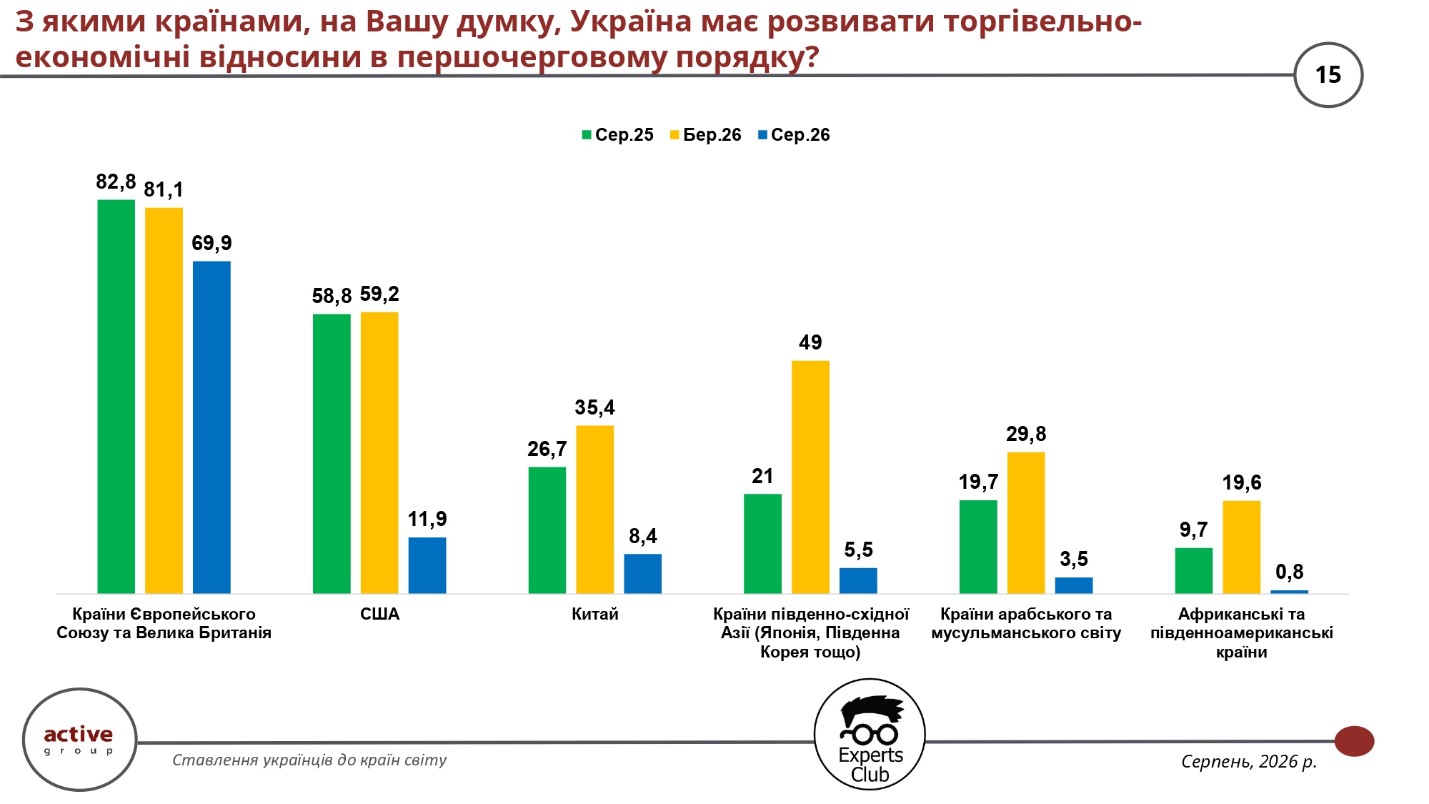
Another 5.5% of those surveyed in August advocated for prioritizing the deepening of economic relations with countries in Southeast Asia—Japan, South Korea, and other nations in the region. In March, this figure stood at 49%, and a year earlier—at 21%. Countries in the Arab and Muslim world were cited by 3.5% of respondents, compared to 29.8% in March, while African and South American countries were cited by 0.8%, compared to 19.6%.
Maksym Urakin, founder of the Experts Club information and analytical center, emphasized the need for more active communication between international partners and Ukrainian society.
“We need to regularly showcase concrete achievements and specific actions. Openness toward the media and the public helps strengthen relations, particularly trade relations,” Urakin noted.
According to him, sociological surveys can serve as a practical tool for government agencies, diplomatic missions, and the business community in determining the direction of bilateral relations.
Oleksandr Pozniy, director of the research firm Active Group, also highlighted the need to strengthen the economic component of international cooperation.
“We need to do more than just raise general awareness. Businesses and government agencies need to work more actively on developing bilateral relations,” Pozniy noted.
The survey was conducted in August 2026 using self-administered online questionnaires via the SunFlowerSociology panel. A total of 800 Ukrainian citizens aged 18 and older were surveyed. The sample is representative by age, gender, and region; the stated maximum theoretical margin of error is ±3.5 percentage points. Previous waves of the survey were conducted in August 2025 and March 2026.
ACTIVE GROUP, CHINA, EUROPEAN UNION, EXPERTS CLUB, FOREIGN TRADE, international relations, SOCIOLOGY, UKRAINE, UNITED KINGDOM, UNITED STATES
Poland became the largest gold buyer among the world’s central banks in January-August 2026, increasing its reserves by approximately 98 tonnes, according to an Experts Club analysis based on World Gold Council (WGC) data published on October 6.
In August, global central banks continued actively increasing their gold reserves, purchasing another 39 tonnes on a net basis compared with 23 tonnes a month earlier. However, the ranking of cumulative purchases since the beginning of the year differs noticeably from the results of August alone.
According to the WGC, the largest gold buyers in January-August 2026 included:
Poland – about 98 tonnes
China – about 80 tonnes
Uzbekistan – about 50 tonnes
Kazakhstan – about 36 tonnes
Czech Republic – about 14 tonnes
The National Bank of Poland retained first place thanks to the continuation of its large-scale precious metal accumulation programme. In August alone, the Polish central bank purchased another approximately 7.8 tonnes.
As a result, Poland’s gold holdings approached 648 tonnes, while the National Bank’s strategic target is 700 tonnes.
China ranks second. In August, the People’s Bank of China was the largest buyer in the world, increasing its reserves by as much as 20.2 tonnes.
In January-August, China purchased about 80 tonnes of gold, while its official gold reserves reached approximately 2,387 tonnes. Gold accounts for about 9% of the country’s international reserves.
At the same time, China has continued buying the precious metal for 22 consecutive months, making it one of the most consistent buyers among the world’s largest central banks.
Uzbekistan ranks third, having increased its gold reserves by approximately 50 tonnes since the beginning of the year. In August, the country purchased another approximately 7.8 tonnes. The total volume of gold in Uzbekistan’s reserves reached approximately 439 tonnes, with the precious metal accounting for about 90% of the country’s international reserves.
Kazakhstan ranks fourth, with purchases of approximately 36 tonnes over eight months. In August, the National Bank of Kazakhstan added about 7.4 tonnes, bringing its gold holdings to approximately 377 tonnes. Gold accounts for about 79% of the country’s international reserves.
The Czech Republic rounds out the top five largest buyers. The Czech National Bank purchased 14 tonnes since the beginning of the year, including approximately 1.7 tonnes in August. The country’s total gold reserves reached around 86 tonnes.
Notably, the Czech Republic has been increasing its gold holdings for 42 consecutive months, implementing one of the most consistent reserve expansion programmes among European central banks.
At the same time, Turkey and Russia became the largest gold sellers since the beginning of 2026. Turkey reduced its reserves by approximately 82 tonnes, although in August it returned to purchases and bought about 2.9 tonnes. Russia sold about 56 tonnes in January-August, including approximately 6.2 tonnes in August.
The World Gold Council notes that the continued presence of the same countries among active buyers indicates the long-term nature of gold accumulation policies. Monthly changes in purchase volumes largely reflect the implementation schedules of these programmes, market conditions and the liquidity needs of individual countries.
According to the WGC, in January-August 2026 central banks reported net purchases of approximately 170 tonnes of gold. At the same time, officially recorded changes in reserves do not necessarily reflect total public-sector demand, as some central bank transactions become known with a delay or are not disclosed.
The World Gold Council regularly tracks changes in central banks’ official gold reserves based on data from the International Monetary Fund, national regulators and other official sources. The WGC regards central bank demand as one of the key factors in the global gold market.
Central banks, CHINA, CZECH REPUBLIC, EXPERTS CLUB, GOLD, gold reserves, KAZAKHSTAN, POLAND, UZBEKISTAN, WORLD GOLD COUNCIL

In August 2026, central banks around the world increased their official gold reserves by a total of 39 metric tons in net terms, with the People’s Bank of China emerging as the largest buyer, according to an analysis by Experts Club based on data from the World Gold Council (WGC) published on October 6.
According to the WGC, the main buyers of gold in August were:
China — 20.2 metric tons
Poland — 7.8 metric tons
Uzbekistan — 7.8 metric tons
Kazakhstan — 7.4 metric tons
Turkey — 2.9 metric tons
Czech Republic — 1.7 metric tons
Bolivia—about 1 metric ton
Ghana—about 1 metric ton
China continued to purchase gold for the 22nd consecutive month. In August, the People’s Bank of China increased its gold reserves by approximately 20.2 metric tons—the largest monthly increase since October 2023.
From January through August, China purchased about 80 metric tons of gold. The country’s official gold reserves reached approximately 2,387 metric tons, accounting for about 9% of China’s total international reserves.
Despite China’s lead in August alone, Poland remains the largest buyer of gold since the beginning of 2026. The National Bank of Poland purchased about 7.8 metric tons in August and 98 metric tons since the start of the year. Poland’s gold reserves have grown to approximately 648 metric tons, approaching its stated target of 700 metric tons.
Uzbekistan increased its reserves by approximately 7.8 metric tons. Since the beginning of the year, the country has purchased about 50 metric tons of gold, bringing its total gold reserves to approximately 439 metric tons. Gold accounts for about 90% of Uzbekistan’s reserves.
Kazakhstan purchased about 7.4 metric tons of gold in August, bringing its total purchases since the beginning of the year to approximately 36 metric tons. The country’s gold reserves reached about 377 metric tons, or 79% of its international reserves.
Turkey returned to net purchases after three months of sales, acquiring about 2.9 metric tons. However, since the beginning of 2026, the country has remained a major net seller—the total reduction in reserves amounts to about 82 metric tons, with the bulk of sales occurring in the first quarter.
The Czech National Bank purchased about 1.7 metric tons, thereby extending its streak of net gold purchases to 42 consecutive months. Since the start of the year, the Czech Republic has added about 14 metric tons, increasing its reserves to 86 metric tons.
Overall, from January through August 2026, central banks worldwide reported net purchases of approximately 170 metric tons of gold.
The World Gold Council notes that the composition of the largest buyers remains relatively stable. This indicates that central banks are purchasing gold primarily as part of their long-term reserve management policies, while monthly fluctuations are linked to the timing of program implementation, market conditions, and individual countries’ liquidity needs.
For comparison: in July, central banks worldwide purchased 23 metric tons of gold on a net basis. Thus, in August, the volume of net purchases increased by approximately 70% month-over-month.
Official source: World Gold Council, Central Bank Gold Statistics, published on October 6, 2026.
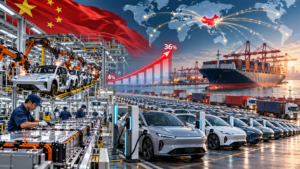
Over the past 25 years, China has increased its share of global automobile production approximately ninefold—from 4% in 2000 to 36% in 2025—transforming itself from a relatively small manufacturer into the world’s largest automotive hub. This was reported by the Experts Club information and analytical center, citing a study by the consulting firm Strategy Partners.
According to analysts’ estimates, around 2 million vehicles were produced in China in 2000, while by 2025 production exceeded 34 million vehicles per year. Thus, over a quarter of a century, the volume of Chinese automobile production increased approximately 17-fold.
China’s position strengthened particularly rapidly after 2010. The country not only formed the world’s largest domestic automobile market, but also created a large-scale manufacturing base covering virtually the entire value chain — from components and batteries to vehicle manufacturing and software.
One of the main factors behind the further growth of China’s automotive industry was the transition to electric vehicles and hybrid models. Chinese manufacturers gained strong positions in the new energy vehicle segment — NEV, which includes fully electric vehicles and plug-in hybrids.
At the same time, Chinese companies are actively increasing their presence abroad. China has become the world’s largest automobile exporter, while local manufacturers are expanding sales and creating their own production capacities in Europe, Asia, Latin America and other regions.
As a result, the structure of the global automobile market has also changed. While in the early 2000s it was shaped primarily by manufacturers from the United States, Japan and Western Europe, by the mid-2020s China had become the industry’s largest individual manufacturing hub.
The growth of China’s automotive industry is accompanied by the strengthening of its own national brands. BYD, Geely, Chery, SAIC, Great Wall Motor and other manufacturers are increasingly competing with European, American, Japanese and South Korean automotive groups not only in China’s domestic market but also in export markets.
China’s own battery manufacturing base has become a significant competitive advantage. Chinese companies hold leading positions in the global production of traction batteries, while the country controls a significant share of global production chains related to raw material processing and the manufacture of components for electric vehicles.
According to Strategy Partners, the transformation of China’s automotive industry demonstrates the country’s transition from a model of catching-up industrial development to technological leadership in certain segments of the industry.
If current trends continue, competition between Chinese and traditional global automakers will increasingly shift into the areas of electric vehicles, battery technologies, software, autonomous driving and production costs.
auto industry, AUTOMOBILE, CHINA, Electric vehicle, PRODUCTION
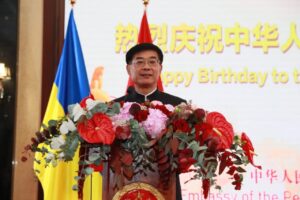
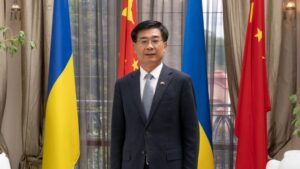
China is ready to remain a reliable partner of Ukraine and to expand mutually beneficial cooperation between the two countries, said Ma Shenkun, Ambassador of the People’s Republic of China to Ukraine.
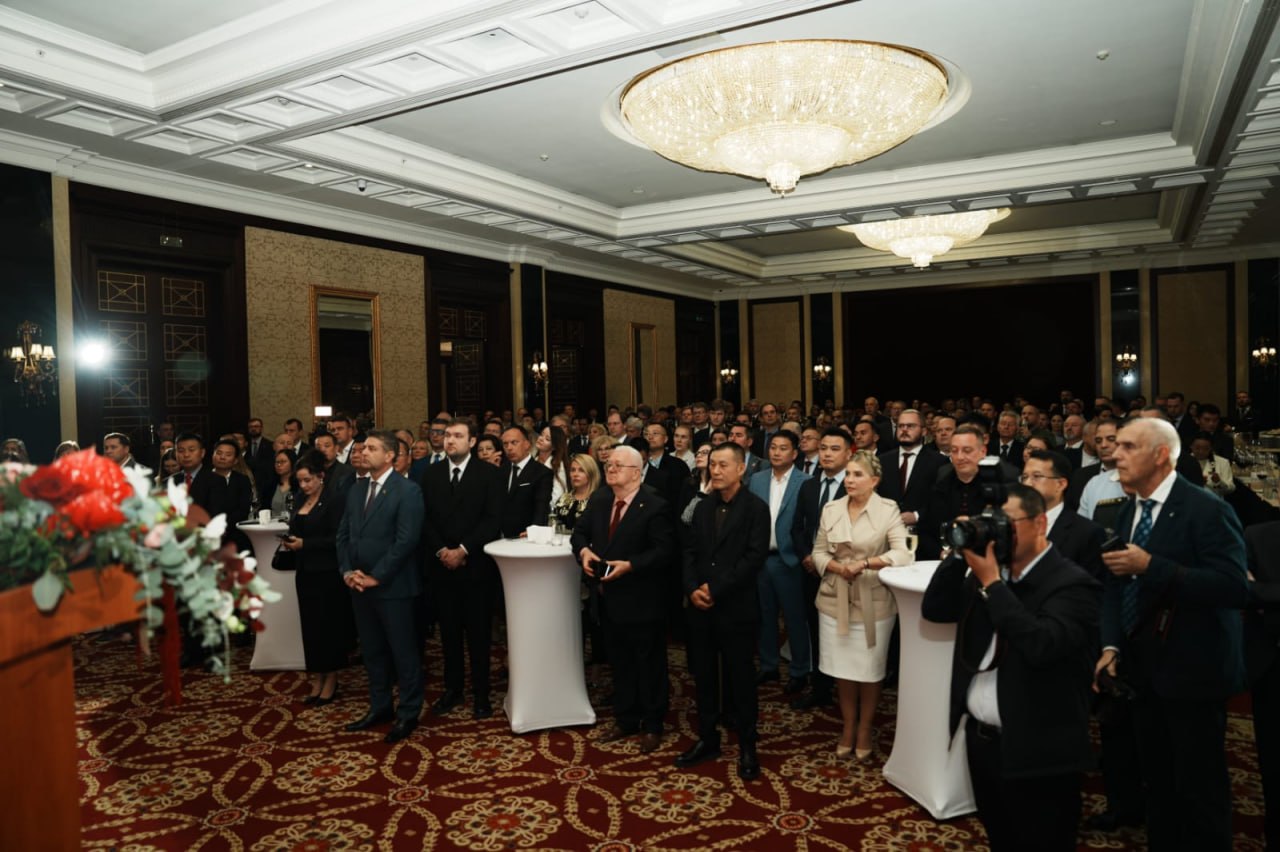
“The economies of China and Ukraine are highly complementary, so cooperation between the two countries has broad prospects. China is ready to be a reliable partner of Ukraine. We are committed to further expanding mutually beneficial cooperation, bringing greater benefits to the peoples of both countries, and jointly opening up new prospects for the development of China-Ukraine relations,” the ambassador said during a reception in Kyiv marking the 77th anniversary of the founding of the People’s Republic of China.
The event was attended by Ukraine’s Deputy Minister of Foreign Affairs Yevhen Perebyinis, as well as representatives of the diplomatic corps, Ukrainian government and civil society organizations, the business community, and the Chinese community.
Ma Shengkun noted that 2026 will mark the 15th anniversary of the establishment of the China-Ukraine strategic partnership, and in 2027, the two countries will celebrate the 35th anniversary of the establishment of diplomatic relations.
According to him, China has remained Ukraine’s largest trading partner for many years and is one of the main sources of Ukrainian imports.
The ambassador highlighted the development of bilateral trade in agricultural products. Specifically, in 2025, Ukraine and China signed protocols opening opportunities for the export of Ukrainian peas and wild-caught aquatic biological resources, and in 2026, they signed a protocol regarding the export of Ukrainian wheat flour to China.
“This creates a solid foundation for the further expansion of Ukrainian agricultural exports,” noted Ma Shenkun.
Speaking about the state of the Chinese economy, the diplomat reported that China’s GDP in the first half of 2026 reached 69.6 trillion yuan, an increase of 4.7% compared to the same period last year.
According to him, China intends to continue developing high-tech manufacturing, new energy, artificial intelligence, robotics, and innovative pharmaceuticals, while simultaneously opening its economy further to the outside world.
Ma Shengkun also addressed Beijing’s position on the war in Ukraine. He stated that China advocates for a political settlement and the continuation of diplomatic efforts.
“China will continue to stand firmly on the side of peace and support all efforts that promote peace. In turn, China will continue to play a constructive role in facilitating the swiftest possible ceasefire and cessation of hostilities and, ultimately, the achievement of a peace agreement,” the ambassador stated.
He noted that nearly two years of work in Ukraine have convinced him that the Ukrainian economy has significant potential for further development and cooperation with China.
A significant portion of the ambassador’s speech was devoted to the achievements of the PRC’s 77-year development. Ma Shengkun noted that China has become the world’s second-largest economy, a global leader in the volume of merchandise trade, and one of the main trading partners of more than 160 countries and regions.
The diplomat also stated Beijing’s intention to continue international cooperation within the framework of the “Belt and Road” initiative, which, he said, has been joined by over 150 countries and more than 30 international organizations, with the number of infrastructure and industrial projects currently underway exceeding 4,000.
According to a study by the Experts Club think tank, China ranked first among Ukraine’s largest trading partners in the first half of 2026. Trade between the countries totaled approximately $14.68 billion, including imports of Chinese goods to Ukraine of about $13.9 billion and Ukrainian exports to China of about $778 million. China accounted for about 21.9% of Ukraine’s total trade with its 50 largest trading partners and 29.4% of imports from this group of countries. At the same time, Ukraine’s trade deficit with China amounted to approximately $13.12 billion. Experts Club study on Ukraine’s largest trading partners in the first half of 2026
According to data from the State Customs Service, this trend continued in January–August 2026: China remained the largest supplier of goods to Ukraine, with imports totaling over $19.6 billion.
The People’s Republic of China recognized Ukraine’s independence on December 27, 1991, and diplomatic relations between the two countries were established on January 4, 1992. The Embassy of the People’s Republic of China in Kyiv began operations in 1992. That same year, the Embassy of Ukraine in Beijing began operations. In 2011, Ukraine and China established a strategic partnership.
According to Experts Club, the implementation of transportation projects under the “One Belt, One Road” initiative could boost trade among countries along the relevant corridors by 2.8–9.7%, said Chinese Ambassador to Ukraine Ma Shengkun, citing a World Bank study.
As the diplomat wrote in a column on the Interfax-Ukraine website, according to estimates by the World Bank and other international organizations, the development of infrastructure connectivity contributes to the expansion of trade and the reduction of poverty in countries participating in the initiative.
In particular, if transportation projects are fully implemented, travel time along the relevant corridors could potentially be reduced by up to 12%, global trade could increase by 1.7–6.2%, and global real income could rise by 0.7–2.9%.
As examples of infrastructure projects, the ambassador cited the China–Laos Railway and the Jakarta–Bandung high-speed rail line in Indonesia.
According to the data he provided, by the end of 2025, the China–Laos Railway had carried out over 64 million passenger trips and transported over 74 million metric tons of cargo. The range of goods transported exceeded 3,800 items, and the transportation network spanned 19 countries and regions.
The Jakarta–Bandung high-speed railway, which began commercial operations in October 2023, had transported more than 16.58 million passengers by July 2026.
As previously reported, China remains Ukraine’s largest trading partner. According to an analysis by Experts Club, Ukraine’s trade turnover with China in January–June 2026 reached $14.68 billion, with $13.9 billion accounted for by imports of Chinese goods and $778.4 million by Ukrainian exports.
According to data from the State Customs Service of Ukraine, imports from China exceeded $19.6 billion in January–August 2026—significantly more than from Poland ($6.3 billion) and Germany ($4.4 billion), which ranked next among the largest suppliers of goods to Ukraine.
A study by Experts Club and Active Group dated September 18, 2026 notes a significant gap between the scale of Ukraine’s economic interaction with China and the structure of bilateral trade: China remains the country’s largest trading partner, yet Ukrainian exports to the Chinese market lag significantly behind imports.



