

JSC “Barsky Machine-Building Plant” (“Barmash,” Bar, Vinnytsia Oblast), a major Ukrainian manufacturer of equipment for the food industry, as well as gas and electric boilers, plans to allocate its 2025 net profit of 5.59 million UAH toward business operations.
According to the published draft resolution of the company’s general meeting of shareholders, scheduled for November 5, there are no plans to pay dividends.
In previous years, the plant also allocated its net profit to business operations.
According to data from YouControl, the company is owned by the Luk family through Ligaterm LLC; the ultimate beneficiaries are Barmash CEO Gennadiy Luk and his father, Ilya Luk.
The main areas of activity for the companies in the Luk family group include the production and sale of industrial equipment for various sectors (“Barmash,” “Ligaterm”), agriculture (Agricultural LLC “Mateykivinvestagro”), the production of bottled mineral water (POP “Ukraine”), and trade (LLC “Altair”).
Shareholders also plan to approve the reports of the management and supervisory board for the past year, as well as the financial results.
Barsky Machine-Building Plant manufactures, among other things, equipment for the spirits, wine, oil and fat, canning, confectionery, and baking industries; since 2001, it has also produced gas, electric, and solid-fuel heating boilers under the “TermoBar” trademark. It exports 20–30% of its products.
According to YouControl, in 2025 the company’s net profit decreased by 8.4% compared to 2024—to 5.6 million UAH—while net revenue fell by 14.3% to 99.3 million UAH.
Retained earnings as of the beginning of the current year amounted to 5.43 million UAH.
European Union countries remain in first place in terms of the share of responses from Ukrainians to the question of who contributes most to achieving peace in Ukraine. In August 2026, 44.6% of respondents named EU countries, 25.2% named the U.S., and 23.3% named the United Kingdom. This is evidenced by the results of the third wave of a survey on Ukrainians’ attitudes toward countries around the world, conducted by Active Group in collaboration with Experts Club, according to the Experts Club Information and Analytical Center.
Compared to March 2026, the ratings have changed significantly. In the spring, 63.4% of respondents named EU countries in this context, 53.8% named the United Kingdom, and 29.6% named the United States. In August, the figures for the EU and the United Kingdom fell by 18.8 and 30.5 percentage points, respectively, while the figure for the United States changed much less—by 4.4 percentage points.
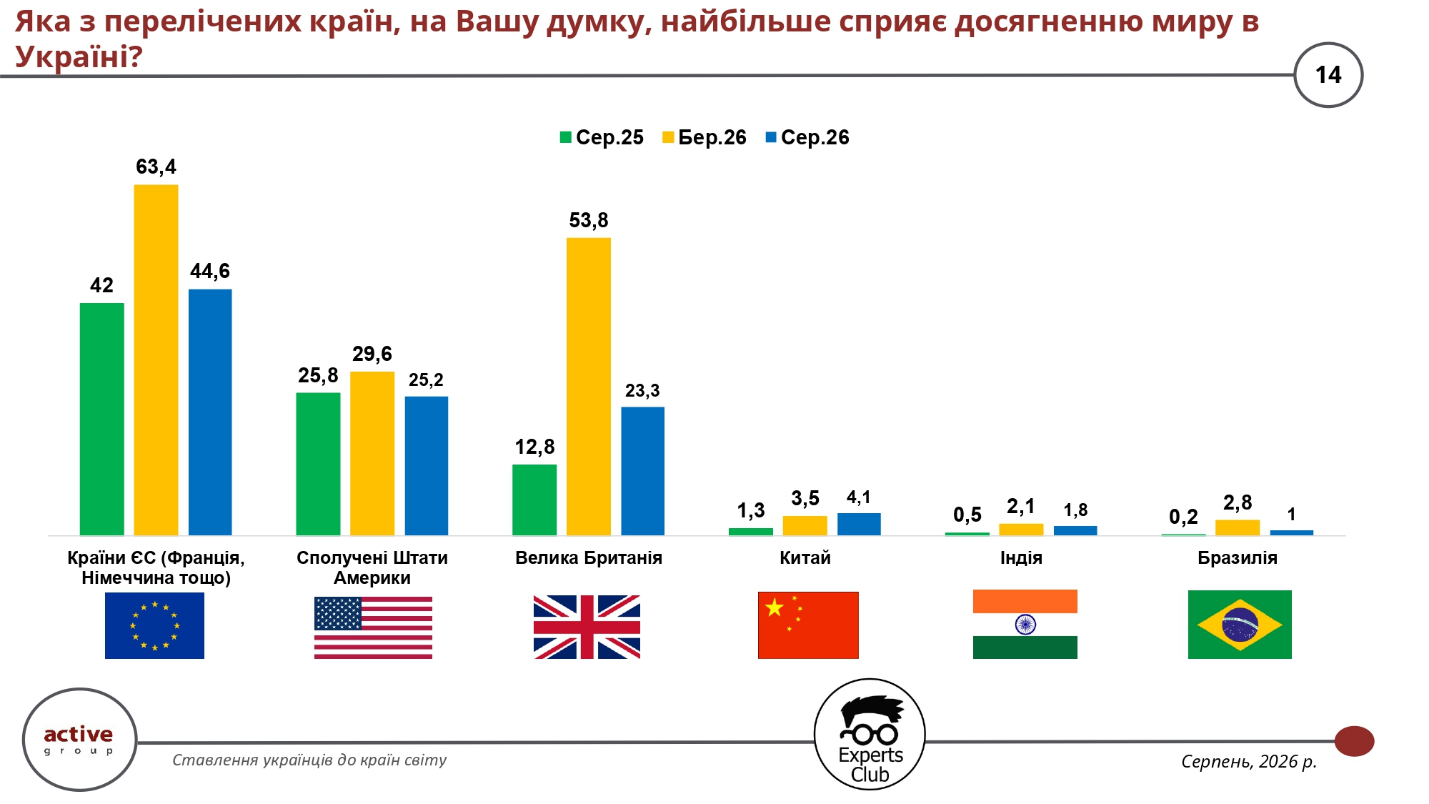
At the same time, compared to August 2025, the share of respondents who named EU countries increased slightly—from 42% to 44.6%. The figure for the U.S. was 25.8% at that time, and for the UK, 12.8%. Thus, the trend in assessments of the UK remains the most dramatic: 12.8% in August 2025, 53.8% in March 2026, and 23.3% in August of this year.
Perceptions of the role of other major powers remain significantly lower. In August 2026, 4.1% of respondents cited China, compared to 3.5% in March and 1.3% a year earlier. The figure for India was 1.8%, and for Brazil, 1%.
Oleksandr Pozniy, director of the research firm Active Group, emphasized that public perceptions of countries should be considered alongside the level of awareness and the actual development of bilateral relations.
“We need to do more than just raise general awareness. First and foremost, business associations, the Ministry of Economy, and the Ministry of Foreign Affairs must work to develop bilateral relations and improve the balance. Given that Ukraine already lacks funding and we are essentially living off foreign loans, we need to expand cooperation with countries where we can achieve a positive balance,” Pozniy noted.
The survey was conducted in August 2026 using self-administered online questionnaires on the SunFlowerSociology panel. It involved 800 Ukrainian citizens aged 18 and older. According to the organizers, the sample is representative in terms of age, gender, and region, and the stated maximum theoretical statistical margin of error is ±3.5 percentage points. This is the third wave of the study, following surveys conducted in August 2025 and March 2026.
ACTIVE GROUP, EUROPEAN UNION, EXPERTS CLUB, international relations, SOCIOLOGY, UKRAINE, UNITED KINGDOM, UNITED STATES, WORLD

Global shipments of personal computers (PCs) in the third quarter of 2026 fell by 20.1% compared to the same period last year—to 62.7 million units, according to preliminary data from the International Data Corporation (IDC).
This decline marks the second consecutive quarter of contraction. However, in April–June, the decline was less significant—3.8% year-over-year.
“A prolonged shortage of components and a rush to restock at the beginning of the year—when suppliers and distribution channels sought to purchase goods in anticipation of expected price increases for memory—led to demand being exhausted by the start of the third quarter,” the IDC report states.
This disrupted the usual seasonal pattern, under which third-quarter figures are typically higher than those of the second quarter. As a result, sales in July–September fell by 9.1% compared to the previous three months.
“Right now, channel partners are concerned about excess inventory in a market where high prices are holding back demand. This could lead to promotional campaigns and some short-term price reductions for consumers, but we do not expect prices to return to last year’s levels—they will remain high,” notes Jitesh Ubrani, IDC’s research director for consumer devices.
IDC, MARKET, PC, SHIPMENTS, TECHNOLOGY

The administration of U.S. President Donald Trump has proposed imposing a fee of $70,000 for an international student’s initial participation in the Optional Practical Training (OPT) program and an additional $30,000 for subsequent extensions, including those for STEM graduates.
The corresponding draft rule from the U.S. Department of Homeland Security (DHS) was published on October 8, 2026, in the Federal Register. This decision has not yet taken effect: the document is currently open for public comment, with comments accepted until November 9.
The OPT program allows international students with an F-1 visa to temporarily work in the U.S. in their field of study during or after their studies. Typically, graduates can work under OPT for up to 12 months, and an additional extension is available for STEM fields.
Under the new scheme proposed by DHS, a certified college or university would be required to pay the fee before the institution submits an OPT recommendation to the SEVIS system. Without confirmation of payment of the new fee, a student will not be able to obtain a work authorization.
If the rule is approved as currently proposed, the cost of accessing OPT will increase tenfold. Currently, obtaining a work permit costs approximately a few hundred dollars, whereas the proposed model calls for $70,000 for the initial recommendation and an additional $30,000 for each subsequent one.
DHS justifies the reform by citing the need to combat fraud and abuse in the OPT program, as well as to protect the U.S. labor market. In the draft rule, the agency refers to cases of fictitious employment of international graduates and potential violations in the program identified by ICE.
Reuters notes that OPT is one of the key pathways through which international graduates of U.S. universities gain their first work experience in the U.S. and then often transition to H-1B work visas. Therefore, the introduction of such a high fee could significantly reduce the number of graduates who remain to work in the country after completing their studies.
At the same time, the group potentially affected is very large. According to Open Doors 2025, there were 1.178 million international students at U.S. colleges and universities during the 2024–25 academic year, accounting for about 6% of all U.S. higher education students. Of these, 294,300 participated in OPT, with the number of program participants rising by 21% over the course of the year.
The largest numbers of international students come to the U.S. from India (363,000), China (266,000), South Korea (42,300), Canada (29,900), and Vietnam (25,600).
There are significantly fewer Ukrainian students at U.S. universities, but their numbers are growing. According to Open Doors 2025, 2,346 students from Ukraine were studying or participating in OPT in the U.S. during the 2024–25 academic year, which is 7.5% more than the previous year.
By comparison, there were 2,183 Ukrainian students in the U.S. during the 2023–24 academic year. At that time, about 55% of them were enrolled in bachelor’s programs, 26% in master’s and doctoral programs, 14% were participating in OPT, and another 5% were in non-degree programs.
Thus, if the composition of the Ukrainian student population remains roughly the same, the new fees could affect several hundred Ukrainians who plan to stay in the U.S. for professional practice after graduating from American universities. However, Open Doors does not provide the exact number of Ukrainians specifically on OPT in the 2024–25 academic year in its publicly available summary statistics.
Overall, the Ukrainian community in the U.S. is significantly larger than the student population. According to an estimate by the Migration Policy Institute based on the American Community Survey, more than 510,000 immigrants born in Ukraine were living in the U.S. in 2024, and the entire Ukrainian diaspora, including people of Ukrainian descent, was estimated at approximately 1.4 million people.
Critics of the proposal warn that the new fee could make U.S. universities less attractive to international applicants and redirect some students to the United Kingdom, Canada, Australia, and EU countries. The Presidents’ Alliance on Higher Education and Immigration has already stated that such a high financial barrier could seriously disrupt the existing system for attracting foreign graduates to the U.S. labor market.
However, the initiative’s final fate remains uncertain. After the public comment period ends, DHS may amend the proposal, drop some provisions, or adopt the final rule. Additionally, Reuters notes that the new restrictions are likely to face legal challenges.

The Kyiv Business Center has begun operations in the Ukrainian capital, with the aim of ensuring a permanent presence of British companies in the country and deepening industrial ties between the two nations, according to the UK government’s press service.
The hub was established through close collaboration between the National Armaments Director (NAD) Group, industrial partners, and the UK financial sector as part of the “100-Year Partnership” initiative.
“The KBC provides British companies, particularly small and medium-sized enterprises (SMEs), with a base from which they can build trusting relationships with Ukrainian partners, obtain information on the situation on the battlefield, and pursue opportunities for joint development, co-production, and investment,” the statement reads.
It is noted that, until now, the cost, security requirements, and administrative complexity of doing business in Ukraine have made it difficult for small firms to establish a presence in the country.
Luke Pollard, Minister for Defense Readiness and Industry, commenting on the center’s opening, stated that KBC will help unlock new opportunities for investment, growth, and long-term recovery.
“By supporting British companies in Kyiv, we are deepening our ‘100-year partnership’ and turning our shared determination into shared innovation,” he emphasized.
The KBC’s operating model is based on three principles: industry, innovation, and investment, providing members with access to a networking platform that helps forge partnerships, attract investment, and expand production and capacity.
National Director of Armaments Rupert Pierce met with leading industry representatives and small and medium-sized businesses to mark the launch of the center, which brings together British and Ukrainian industry.
“This new facility is not just a center; it is a permanent channel that transforms the UK’s ability to collaborate fruitfully with our Ukrainian partners, both now and in the long term. Until now, costs, security concerns, and other restrictions caused by Russia’s full-scale invasion have made it difficult for companies—especially small ones—to operate in Ukraine. Our previous trade missions successfully addressed some of these challenges—this center removes these barriers by providing British companies with a permanent presence in Kyiv, opening up real opportunities for innovation, investment, and exports,” he emphasized.
The center’s operating model builds on more than 40 existing major industrial partnerships between the United Kingdom and Ukraine, as well as on the success of the UK Ministry of Defense’s trade missions to Ukraine. KBC also supports Ukrainian companies seeking British industrial partners or establishing subsidiaries in the United Kingdom.

Ukraine’s foreign trade in goods in January–August 2026 was characterized by imports significantly exceeding exports and the concentration of the negative trade balance in relations with several of its largest partners. According to calculations based on the table “Ukraine’s Foreign Trade with Selected Countries” as of August 31, total trade turnover amounted to $92.95 billion, imports to $66.25 billion, and exports to $26.70 billion. The negative balance reached $39.55 billion, while imports exceeded exports by a factor of 2.48.
Exports covered only 40.3% of the value of imported goods. China was the largest individual trading partner and supplier, Poland was the main market for Ukrainian products, and the European Union as a whole accounted for 59.1% of Ukraine’s merchandise exports. Meanwhile, the largest positive trade balances were recorded in trade with Moldova, Spain, and Egypt.
“For every hundred dollars of merchandise imports, there were approximately forty dollars of merchandise exports. This ratio demonstrates the limited ability of the export sector to balance the economy’s demand for foreign products. Some imports support production and reconstruction, so they must be assessed with regard to the purpose of the goods. To improve the balance in the long term, the equipment purchased must help increase the output of competitive products in Ukraine,” said Maksym Urakin, PhD in Economics and founder of the Experts Club information and analytical center.
Ukraine recorded its largest trade turnover with China at $20.56 billion, or 22.1% of the total. Poland ranked second with $9.54 billion, followed by Germany with $6.10 billion. Ukraine had almost the same volume of trade with Turkey, at $6.08 billion, with the difference compared with Germany amounting to just $20.9 million. The United States completed the top five partners with $3.91 billion.

These five countries accounted for 49.7% of trade turnover, while the ten largest partners accounted for 63.4%. Thus, trade results with a relatively small group of countries largely determined Ukraine’s overall foreign trade balance.
Ukraine’s Ten Largest Trading Partners by Trade Turnover in January–August 2026, USD Billion
| Country | Imports | Exports | Balance | Trade Turnover |
|---|---|---|---|---|
| China | 19.639 | 0.924 | −18.715 | 20.563 |
| Poland | 6.277 | 3.261 | −3.016 | 9.538 |
| Germany | 4.377 | 1.726 | −2.651 | 6.104 |
| Turkey | 3.991 | 2.092 | −1.899 | 6.083 |
| United States | 3.210 | 0.700 | −2.510 | 3.910 |
| Italy | 1.834 | 1.519 | −0.315 | 3.353 |
| Netherlands | 1.151 | 1.311 | +0.160 | 2.462 |
| Hungary | 1.549 | 0.846 | −0.703 | 2.394 |
| Czech Republic | 1.670 | 0.705 | −0.965 | 2.375 |
| Slovakia | 1.343 | 0.792 | −0.551 | 2.135 |
Source: State Customs Service of Ukraine
The next largest partners included Romania, with trade turnover of $2.05 billion, Spain with $1.98 billion, Lithuania with $1.80 billion, France with $1.77 billion, and Greece with $1.52 billion. Total trade turnover with the 27 EU member states amounted to $43.60 billion, or 46.9% of the overall figure. Ukrainian exports to the EU totaled $15.78 billion, imports reached $27.81 billion, and the deficit amounted to $12.03 billion.
The EU’s high share of exports means that access to the European market is of decisive importance for Ukrainian producers. At the same time, substantial purchases from EU countries constitute a separate source of the trade deficit. The situation within this trade relationship is uneven: the largest gaps are recorded with Poland and Germany, while Ukraine has positive trade balances with Spain and the Netherlands.
China supplied $19.64 billion worth of imports, or 29.6% of total merchandise imports. Supplies from Poland amounted to $6.28 billion, or 9.5%, while those from Germany reached $4.38 billion, or 6.6%. Together, these three countries accounted for 45.7% of Ukraine’s merchandise imports.
The five largest suppliers also included Turkey with $3.99 billion and the United States with $3.21 billion. The combined share of the top five reached 56.6%, while the ten largest suppliers accounted for 68.3%. Other major sources of imports included Italy with $1.83 billion, the Czech Republic with $1.67 billion, Hungary with $1.55 billion, and Slovakia and Lithuania with approximately $1.34 billion each.

The State Customs Service provides a breakdown of the overall commodity structure for the same period. In January–August 2026, Ukraine imported machinery, equipment, and transport vehicles worth more than $29.9 billion, fuel and energy products worth more than $9.5 billion, and chemical industry products worth more than $9 billion. These categories accounted for more than 73% of imports; machinery, equipment, and transport represented approximately 45%.
This ratio indicates the significant role of industrial and energy products in imports. However, the broad category of machinery and transport includes goods intended for different purposes. Its entire value cannot be interpreted as investment in production: doing so would require separate analysis of industrial equipment, components, vehicles, and final consumer goods.
“The concentration of almost one-third of imports with a single supplier makes Ukrainian businesses sensitive to supply conditions from China. Logistics disruptions or changes in component prices may affect many enterprises simultaneously. At the same time, reducing purchases without affordable alternatives could constrain Ukrainian production itself. The practical task is to diversify suppliers and develop domestic production of goods for which Ukraine has the economic and technological prerequisites,” Urakin commented.
Poland remained the largest export market, receiving goods worth $3.26 billion, or 12.2% of Ukraine’s total exports. Turkey ranked second with $2.09 billion and a share of 7.8%, followed by Germany with $1.73 billion and 6.5%. Italy followed with $1.52 billion, the Netherlands with $1.31 billion, and Spain with $1.29 billion.
Exports to China amounted to $924.2 million, Romania to $878.0 million, Hungary to $845.6 million, and Slovakia to $792.4 million. Egypt and Moldova purchased Ukrainian goods worth $751.0 million and $750.5 million, respectively. Supplies to the Czech Republic amounted to $705.2 million, while exports to the United States reached $700.0 million.

Exports were less concentrated among individual countries than imports: the three largest markets accounted for 26.5% of shipments, the top five for 37.1%, and the top ten for 54.8%. At the same time, the EU’s dominance as a combined market means that the diversity of destination countries only partially reduces dependence on the economic and regulatory conditions they share.
According to the State Customs Service, food exports exceeded $15.4 billion over the eight months, exports of metals and metal products approached $2.7 billion, and exports of machinery, equipment, and transport approached $2.4 billion. The approximate shares of these groups in total exports were 58%, 10%, and 9%, respectively. Food products remained the main source of merchandise export revenue. [2]
“The geography of exports allows Ukraine to operate in different markets, but the commodity structure remains heavily dependent on food products. For such shipments, harvest volumes, global prices, and transportation costs are particularly important. The development of processing can increase revenue per unit of raw material, although it requires investment and a stable energy supply. At the same time, industrial exports must be expanded so that the performance of several agricultural commodity groups has less influence on the overall picture,” Maksym Urakin noted.
The largest bilateral deficit was recorded in trade with China at $18.71 billion. This was equivalent to 47.3% of Ukraine’s net merchandise trade deficit. Exports to China covered only 4.7% of imports from that country, while Chinese goods accounted for 95.5% of bilateral trade turnover.
The second-largest deficit was recorded with Poland at $3.02 billion. Germany followed with $2.65 billion, the United States with $2.51 billion, and Turkey with $1.90 billion. Together, the negative trade balance with these five countries amounted to $28.79 billion.
Significant deficits were also recorded in trade with Greece at $1.07 billion, the Czech Republic at $964.7 million, Lithuania at $864.6 million, France at $864.5 million, and Taiwan at $844.5 million. Thus, the imbalance extended far beyond relations with the single largest supplier.
The sum of negative trade balances across all deficit-producing trade relationships reached $43.90 billion. Positive balances totaling $4.35 billion in other rows of the table reduced this amount to an overall deficit of $39.55 billion. Accordingly, China accounted for 42.6% of the sum of bilateral deficits, while the five largest deficit-producing trade relationships accounted for 65.6%. This provides a more accurate picture of their concentration than comparing them solely with the net result after surpluses are taken into account.
“The deficit with China exceeds the combined negative trade balance with all EU countries. This illustrates how unevenly Ukraine’s dependence on imports is distributed. At the same time, a bilateral deficit in itself does not determine whether trade with a particular country is economically beneficial. It is necessary to assess how imported goods are used domestically and what contribution they make to employment, production, and future exports,” Urakin emphasized.
Ukraine recorded its largest positive trade balance with Moldova at $640.6 million. With exports of $750.5 million, imports from that country amounted to $109.9 million, meaning that Ukrainian supplies exceeded imports by almost 6.8 times. Spain ranked second in terms of the surplus, at $613.0 million: exports to Spain reached $1.29 billion, while imports amounted to $681.8 million.
The third-largest surplus was recorded with Egypt at $493.5 million. Algeria followed with $361.0 million, Lebanon with $258.7 million, and Libya with $219.8 million. The positive balance with Iraq amounted to $169.1 million, the Netherlands to $160.1 million, Tunisia to $157.0 million, and Yemen to $134.0 million.
The five largest surpluses – with Moldova, Spain, Egypt, Algeria, and Lebanon – totaled $2.37 billion, or 54.4% of all positive balances. However, surplus-generating trade relationships offset only 9.9% of the sum of bilateral deficits overall. Even successful export markets had not yet generated sufficient revenue to balance purchases from the largest suppliers.
“Moldova, Spain, and Egypt demonstrate that Ukraine has markets where its own supplies significantly exceed imports. These should be considered a basis for expanding product ranges and strengthening long-term relationships with buyers. However, a large surplus in an individual trade relationship does not necessarily mean it can be increased rapidly without demand constraints. To have a tangible impact on the overall balance, exports must increase simultaneously across many markets,” Maksym Urakin believes.
A detailed breakdown by commodity helps explain differences between trade relationships. Below, figures for January–August 2026 are supplemented with reference data for 2025 and other explicitly specified periods. Historical shares describe their respective periods and cannot automatically be applied to the first eight months of 2026.
According to GMK Center calculations based on State Customs Service data, Ukraine supplied 7 million tonnes of iron ore to China in January–August 2026, 38% less than a year earlier. This represented approximately 44% of Ukraine’s total iron ore exports by physical volume during the period, which amounted to 15.8 million tonnes. The Chinese market thus remained extremely important for the mining industry, although Ukraine’s total exports to China were much smaller than imports.
For its part, the National Institute for Strategic Studies noted in its review of 2025 that machinery, equipment, and transport accounted for 69.8% of Ukrainian imports from China. Comparing these data from different periods highlights the differences in the commodity profiles of bilateral trade: the major role of manufactured products in Chinese supplies is combined with the importance of raw materials in Ukrainian exports. The precise structure of this exchange during the first eight months of 2026 can only be determined through a complete breakdown of commodity categories.
In January–August 2026, Ukraine shipped 2.1 million tonnes of iron ore to Poland. For comparison, Slovakia received 2.9 million tonnes over the same period. These figures illustrate the role of both markets in sales of products from Ukraine’s mining industry.
A broader Polish commodity profile is contained in the Polish Ministry of Development and Technology’s response to parliamentary inquiry No. 17426, reproduced in the Politoskop database. According to the GUS data for 2025 cited there, major supplies from Ukraine to Poland included soybean oil worth €399.7 million, iron ores and concentrates worth €342.3 million, and rolled ferrous metal products worth €315.5 million. In the opposite direction, substantial volumes consisted of petroleum products worth €1.76 billion, unmanned aerial vehicles worth €759.6 million, and passenger cars worth €555.8 million. These figures come from Polish statistics for the full year 2025 and therefore serve as a separate description of the commodity composition of trade.
According to preliminary German official agricultural statistics for 2025, industrial goods accounted for approximately 94% of German supplies to Ukraine. Meanwhile, Germany imported agricultural and food products from Ukraine worth approximately €1.3 billion and industrial sector goods worth €1.8 billion. Agricultural supplies notably included oilseeds, primarily rapeseed, as well as vegetable oils worth €172 million and processed fruit products and preserved fruit worth €101 million. This structure indicates that Ukrainian exports to Germany also include a substantial industrial component.
According to the analysis by the National Institute for Strategic Studies, corn was an important item in Ukrainian exports to Turkey in 2025, with shipments worth approximately $1.2 billion. Among imports from Turkey, petroleum products accounted for $639 million, while the aggregated category of “other goods” amounted to $2.1 billion. Without further detail, it would be incorrect to associate the latter with any specific industry. Data for January–August 2026 also confirm the presence of metallurgical trade: according to GMK Center calculations, Ukraine exported 83,200 tonnes of pig iron to Turkey.
In January–August 2026, the United States purchased 900,600 tonnes of Ukrainian pig iron, while total exports of this product amounted to approximately 1.03 million tonnes. Thus, the US market accounted for approximately 87% of shipments by physical volume. Italy received 26,500 tonnes during the same period. Sales of an individual commodity may be much more concentrated in one market than Ukraine’s total exports across countries.
Data from the Verkhovna Rada Committee on Agrarian and Land Policy, citing the State Customs Service, demonstrate the importance of the Spanish, Italian, and Indian markets for the vegetable oil industry. In the first half of 2025, Spain purchased Ukrainian sunflower oil worth $356.9 million, Italy purchased $337.5 million, and India purchased $326.1 million. Their shares in the value of exports of this product were 12.88%, 12.18%, and 11.77%, respectively. This is an example of the specialization of individual markets in sales of Ukrainian processed agricultural products, not an estimate of their shares for January–August 2026.
The geographic and commodity data indicate a combination of high demand for imported industrial products with exports dominated by food products, while ore and metallurgical products play a substantial role in certain trade relationships. Given this structure, opportunities to improve the balance depend on production capacity, energy supply, accessible logistics, and conditions for entering foreign markets.
At the same time, the merchandise trade deficit is not equivalent to a deficit in the overall balance of payments or an automatic reduction in foreign exchange reserves by the same amount. External financing is also influenced by trade in services, income, transfers, and financial transactions. Therefore, the figure of $39.55 billion specifically characterizes the gap between merchandise exports and imports within the statistics presented.
“Improving the trade balance requires expanding the capacity of Ukrainian enterprises to produce goods and sell them abroad. Equipment purchases can contribute to this if they are accompanied by investment in production, access to energy, and clear operating conditions. Stable transportation and the ability to fulfill contracts without forced interruptions are equally important for exporters. It is the growth of competitive domestic production that can gradually narrow the gap between imports and exports,” Maksym Urakin concluded.
ECONOMY, EXPERTS CLUB, EXPORTS, FOREIGN TRADE, IMPORTS, TRADE DEFICIT, UKRAINE



