

KG Group LLC plans to raise $8.6 million to implement a project to build a biomethane plant in the Poltava region, according to the Ukraine Investment Guide 2026, presented at the Ukraine Recovery Conference 2026 (URC2026) in Gdańsk, Poland.
The total project budget is $15.7 million, of which the company is prepared to finance $7.1 million with its own funds, while the remainder ($8.6 million) is planned to be raised from investors.
The project has two potential locations—in the Semenivska or Omelnytska territorial communities of the Poltava region. Waste from local agricultural enterprises will serve as the raw material for biomethane production.
The catalog states that the feasibility study has already been developed, the land plot for construction has been secured, and gas pipelines to the future plant have been designed. Currently, the selection of an equipment manufacturer and the design of the connection to gas distribution networks are underway.
Founded in 2004, KG Group LLC is a Ukrainian group of companies comprising six enterprises. It operates in the field of natural gas and electricity supply, engages in the design, construction, and reconstruction of gas and heating networks and facilities, and handles the sale and servicing of gas equipment. Its main region of operation is the Poltava Oblast.
Last year, KG Group LLC increased its revenue by 39.5% to 69.1 million UAH and its net profit by 13.2% to 4.3 million UAH.

Imports of goods into Ukraine from January through June 2026, in monetary terms, increased by 29% compared to the same period in 2025—from $38.3 billion to $49.3 billion, according to data from the Telegram channel of the State Customs Service (SCS) of Ukraine.
In contrast, the value of exports is growing more slowly: in January–June 2026, it totaled $21 billion, compared to $20 billion a year earlier.
“At the same time, taxable imports totaled $34.6 billion, accounting for 70% of the total volume of imported goods. The tax burden per kilogram of taxable imports in January–June 2026 was $0.58/kg,” the publication states.
The largest volumes of goods were imported into Ukraine from China ($13.9 billion), Poland ($4.7 billion), and Germany ($3.2 billion). The largest exports from Ukraine went to Poland ($2.4 billion), Turkey ($1.8 billion), and Italy ($1.3 billion).
Of the total volume of goods imported in January–June 2026, 72% consisted of the following categories: machinery, equipment, and transportation—$21.3 billion (upon customs clearance of these goods, 120.6 billion UAH, or 28% of customs duties, was paid to the budget); fuel and energy products—$7.4 billion (UAH 148.3 billion, or 34% of customs revenue), and chemical industry products—$6.9 billion (UAH 56.8 billion, or 13% of customs revenue).
The top three most exported goods from Ukraine were food products—$12.5 billion; metals and metal products—$2.2 billion; and machinery, equipment, and transportation vehicles—$1.8 billion.
The State Customs Service added that from January through June 2026, 802.3 million UAH was paid to the budget during customs clearance of exports of goods subject to export duties.

The Antimonopoly Committee of Ukraine has granted permission to AB Diamant Ukraine LLC, whose ultimate beneficial owner is Chinese citizen Cai Yi, to acquire control over more than 50% of Power Energy Katyuzhanka LLC.
“AB Diamant Ukraine LLC has been granted permission to acquire control over Power Energy Katyuzhanka LLC through the direct purchase of shares in the authorized capital, which ensures a majority of more than 50% of the votes in the company’s highest governing body,” – states the AMCU’s decision dated July 9, 2026.
Power Energy Katyuzhanka LLC was founded on September 20, 2023, with a registered capital of 8.746 million UAH. The company’s primary activity is the production of electricity.
The ultimate beneficial owner of Power Energy Katyuzhanka LLC, holding a 100% stake, is Roman Petruchenko—co-founder of SPP Development Ukraine, a Ukrainian group of companies in the renewable energy sector.

Nine European countries—Belgium, France, Germany, Greece, Italy, Malta, the Netherlands, Portugal, and Switzerland—have asked the European Commission to extend the temporary mechanism that eases the implementation of the new Entry/Exit System (EES) at the external borders of the Schengen Area.
The EES requires mandatory electronic registration of non-EU citizens when crossing the border, including facial recognition and fingerprinting. According to the countries that initiated the appeal, the first months of the system’s operation revealed serious problems at a number of airports and border crossing points: lines grew longer, processing times increased, and the burden on border services rose.
The current temporary mechanism allows for the waiver of biometric data collection in exceptional cases, while still maintaining electronic registration of travelers. Nine countries believe that abandoning this measure now could lead to new disruptions in border infrastructure operations.
For Ukrainian citizens, this issue has direct practical implications, as Ukrainians are also considered travelers from non-EU countries and are subject to the EES for short-term trips to the Schengen Area.
If the European Commission agrees to extend the temporary mechanism, this could:
reduce the risk of long lines at popular border crossings and major EU airports, especially during peak travel periods; reduce the likelihood of delays for Ukrainian tourists, drivers, business travelers, and seasonal workers when crossing the border;
give EU countries more time to fine-tune the system technically without suspending its operation.
However, Ukrainians should not expect the biometric registration requirement to be lifted. The EES remains a mandatory system, and in most cases, Ukrainian citizens entering the Schengen Area will be required to have their photo taken and provide fingerprints upon their first border crossing after the system’s launch.
Experts note that the extension of the simplified regime signifies a more flexible application of the rules at problematic border crossing points rather than a change in the requirements for travelers themselves.
The EES system is part of a broader reform of the EU’s external border controls and is intended to eventually replace traditional passport stamping with electronic recording of all entries and exits by third-country nationals.

The Administrative Court of Cassation, a division of the Supreme Court, denied the petition filed by People’s Deputy and fifth President of Ukraine Petro Poroshenko to lift the sanctions imposed by a decision of the National Security and Defense Council.
The panel of judges announced this decision on Friday.
As previously reported, on February 13, 2025, Ukrainian President Volodymyr Zelenskyy signed a decree on the NSDC’s February 12 resolution “On the Application of Personal Special Economic and Other Restrictive Measures (Sanctions).” According to the annex to the document, sanctions were imposed against five individuals: Poroshenko, Igor
Kolomoyskyi, former owner of Finance and Credit Bank Konstantin Zhevago, former co-owner of PrivatBank Gennadiy Bogolyubov, and former lawmaker Viktor Medvedchuk.
Poroshenko appealed the sanctions to the Supreme Court. On April 17, the court began hearing the lawsuit in the presence of Ukrainian members of parliament, as well as diplomats from the European Union delegation and representatives of the embassies of Germany, Poland, Austria, Sweden, Lithuania, and Denmark. Poroshenko’s representatives emphasize that the sanctions were imposed unlawfully against a Ukrainian citizen residing in the country, while only Russia considers him a “terrorist.” Consequently, there are no legal grounds for the sanctions.
On May 19, it was reported that the European Court of Human Rights (ECHR) had accepted Poroshenko’s case for consideration. According to the politician’s defense attorney, Ilya Novikov, the lawyers filed two additional complaints: the first challenging the sanctions, and the second alleging a violation of the reasonable time limit for proceedings.
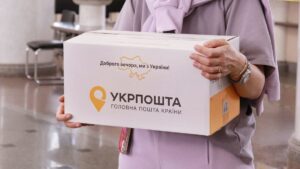
The national postal operator, JSC “Ukrposhta,” reported a pre-tax profit of 122 million UAH in the first half of 2026, compared to a pre-tax loss of 318.8 million UAH during the same period last year and a pre-tax loss of 204.8 million UAH in the first quarter of this year.
“Operating profit (EBITDA)—which excludes the sale of assets, depreciation, and exchange rate fluctuations—amounted to 293 million UAH, nearly six times the target,” wrote the company’s CEO, Ihor Smilianskyi, on Facebook.
In the first half of 2025, EBITDA was negative at 100 million UAH, whereas in the first quarter of this year it turned positive at 25.4 million UAH.
“And we achieved this result despite the injuries and deaths of our employees, the loss of hundreds of new vehicles, damage to and loss of sorting centers, and daily attacks on our branches,” the company’s CEO emphasized.
According to him, the company’s capital as of mid-year exceeded 2.3 billion UAH, compared to 2.2 billion UAH at the beginning of the year.
It is noted that year-over-year growth in the number of packages in June 2026 ranged from 12% to 17%.
“Year-over-year growth in the number of packages in June 2026 ranged from 12% to 17%, depending on the segment, which indicates growing customer confidence,” the CEO emphasized.
Among other achievements, he highlighted a 98% on-time delivery rate, a ranking among the top three global postal operators in terms of international delivery quality, and a market share of over 50% in Ukraine’s highly competitive international shipping market.
“We launched ‘Ukrposhta.Apteka’ nationwide and, for the first time in Ukraine’s history, made it possible to pay by bank card in 100% of populated areas,” Smiliansky added.
The rest of the performance metrics for the first half of the year are not yet available.
The day before, Smiliansky announced the expansion of the network of express parcel lockers. Specifically, the service has been launched in the Lviv and Ivano-Frankivsk regions. Installation has also begun in the frontline regions of Kharkiv, Sumy, and Poltava. Previously, such postal kiosks had already been opened in Odesa, Vinnytsia, Khmelnytskyi, Mykolaiv, Kyiv (122 branches), Dnipro, Zaporizhzhia, and Kropyvnytskyi.
As reported, in January–March 2026, the company posted a net loss of 204.8 million UAH, which is 1.1 million UAH, or 0.5%, more than in the same period of 2025, while its revenue grew by 1.1% to 13 billion 118.42 billion UAH.



