“Woman and golf” – during 5 years of existence of Open women’s tournaments these two words became inseparable. 2020 was a year of developing women`s golf and setting many records. Today, 30% of Ukrainian golfers are women
“The Ukrainian Golf Federation is actively developing golf in various areas: professional, children’s, inclusive, junior and a separate focus of our activity is women’s golf. This year, a number of initiatives have been launched to promote the rapid growth of golfers in Ukraine, including a large percentage of women. For us, the benchmark of achievements is the number of golfers and their results. “- said Vitaliy Khomutynnik, President of the Ukrainian Golf Federation.

Men joined women’s tournaments and play on a separate railway. Every time, the tournament gathers a record number of ladies in one round. For 11 participants, this competition was their debut.
“Everyone here finds theirs. Somebody competes for prizes and victory, someone enjoys the favorite game, and for some ladies, it comes to the first tournament in life. Thanks to this event and a number of other initiatives, we promote women’s golf, break stereotypes about the unavailability of this sport and attract new players “,- comment Elena Rudik, Member of the Federation and Director of Open Ladies Golf Tour.
Every year, participants play better, and new ones can join the world of golf right during the competition. Within the framework of each tournament there is a Golf School, where under the guidance of coaches, women learn the basics of the game. Everyone, who continues to practice, receives free accreditation from the Ukrainian Golf Federation.
According to the results of the competition, the victory was won by Maryna Dyachenko, the second place was taken by Olena Movchan, and the third place was taken by Veronika Rastvortseva. According to the participants of the tournament, golf is a sport that helps to live without losing focus on the main thing and allowing you to always feel the connection with nature.
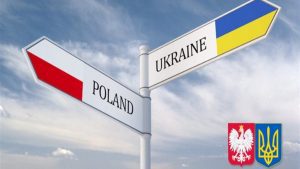
The date of the meeting of the Ukrainian-Polish Intergovernmental Commission on economic cooperation will be agreed upon in the coming weeks. The relevant agreement was reached during a telephone conversation between Ukrainian Foreign Minister Dmytro Kuleba and Polish Foreign Minister Zbigniew Rau on Wednesday.
“Dmytro Kuleba noted the importance of using all opportunities and platforms to promote economic and trade cooperation between Ukraine and Poland amid the continuing effect on the economies of both countries of the coronavirus [COVID-19] pandemic. The ministers agreed in the coming weeks to specify the date of the meeting of the Ukrainian-Polish Intergovernmental Commission on economic cooperation,” the Ukrainian Foreign Ministry’s press service said.
Kuleba and Rau also discussed preparations for the visit of Polish President Andrzej Duda to Ukraine at the invitation of Ukrainian President Volodymyr Zelensky. It is expected that the visit of the Polish president will contribute to the development of political cooperation and will allow reaching new agreements on a wide range of issues on the agenda of strategic partnership between Ukraine and Poland.
In addition, the ministers agreed to speed up the preparation for the video conference of the coordinators from the Foreign Ministries of the Lublin Triangle countries – Ukraine, Poland and Lithuania.
The parties also expressed their commitment to a positive solution to cultural and historical issues.
“Kuleba noted the importance of achieving progress in the implementation of agreements on the restoration of the burial place of UPA [Ukrainian Insurgent Army] soldiers on Mount Monastery near Przemyśl, who died in 1945 in a battle with the NKVD internal troops units. The interlocutors urged not to allow the historical past to influence the good-neighborly nature of the Ukrainian and Polish relations,” the ministry’s press service said.
Rau also said that Poland continues to support for the territorial integrity of Ukraine in the face of Russian aggression and this topic will become a priority during Poland’s chairmanship of the OSCE in 2022. He expressed his conviction that the sanctions of the European Union against Russia for the occupation of Crimea and certain areas of Donetsk and Luhansk regions should remain in force until the full cessation of illegal actions by the Russian Federation.
Rau also confirmed Poland’s unchanging support for Ukraine’s European and Euro-Atlantic aspirations.
The parties exchanged views and noted the commonality of their positions on the development of the situation in Belarus as well.
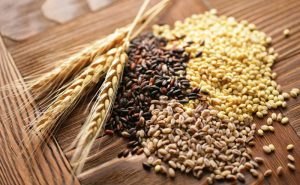
The Ukrainian Grain Association (UGA) in its September report lowered the forecast for the gross harvest of grains and oilseeds this season from 96.7 to 95.6 million tonnes, exports from 58.4 to 56.3 million tonnes due to unfavorable weather conditions for the harvest of late crops in some regions of Ukraine.
“Even after lowering the forecast for the harvest, its figure may be the second in terms of gross harvest after last year’s record – 98 million tonnes, the same can be said about the possible export volumes,” the association said in a press release posted on its website on Wednesday.
So, this year, according to UGA, farmers harvested 26.6 million tonnes of wheat (UGA forecast was at 26.8 million tonnes) and 8.3 million tonnes of barley (UGA predicted 8.2 million tonnes). According to the association’s forecasts, wheat exports this season may reach 17.5 million tonnes (in accordance with the signed memorandum), and barley may reach 4.5 million tonnes.
In addition, UGA slightly lowered its forecast for the corn harvest this season in the September report compared to the previous forecast in August from 36.4 million tonnes to 35.3 million tonnes due to unfavorable dry weather conditions in the southern and partly central regions of Ukraine.
According to UGA experts, farmers will not harvest corn for grain on an area of 205,000 hectares, which is 3.8% of the total area under corn. In other regions, which are the main corn producers, the harvest situation is satisfactory and good, and they are not experiencing critical losses.

Ukraine’s FX reserves in August 2020 tentatively expanded by 1%, to $29.049 billion, according to a Monday posting on the website of the National Bank of Ukraine (NBU).
“As of September 1, 2020, Ukraine’s FX reserves amounted to $29.049 billion (equivalent), according to preliminary data. In August, they increased by 1%, primarily due to the favorable situation in the FX market,” the NBU said in the statement.
According to the central bank, the dynamics of reserves was influenced by its operations in the interbank FX market. In August the regulator bought $460.5 million and did not carry out operations to sell foreign currency. “In August, the supply of foreign currency exceeded demand and the NBU could replenish FX reserves,” the central bank said.
According to the report, the dynamics of reserves in August was also affected by FX earnings in favor of the government in the amount of $250.5 million from the sale of government domestic loan bonds denominated in foreign currency.
At the same time, the government allocated $645.2 million to repay the state debt in foreign currency, including $496.5 million on government bonds denominated in foreign currency, and the rest of the funds were provided for obligations to foreign creditors.
In August the government and the NBU paid $204.5 million to the International Monetary Fund (IMF).
In addition, the dynamics of the indicator in August was influenced by the revaluation of financial instruments (changes in the market value and the exchange rate of the hryvnia versus foreign currencies). Last month their value grew by $385 million in equivalent, according to the National Bank.
The regulator said that as of September 1, 2020, the volume of FX reserves covers 4.8 months of Current External Payments (CXP). This is enough to fulfill the obligations of Ukraine and the current operations of the government and the NBU.
According to the data posted on the website of the National Bank, its net FX reserves, which are calculated as the excess of gold and FX reserves over the central bank’s liabilities in foreign currency, increased by $339.31 million in August, to $17.813 billion after a decrease in July by $21.27 million.
In general, in January-August 2020, the NBU’s net FX reserves grew by 12.9%, or by $2.029 billion.

Head of Zhytomyr Regional Administration Vitaliy Bunechko reported on the ongoing work with a private investor who is seriously considering the issue of building an international airport in Zhytomyr as a public-private partnership.
“In order for the airport to work within the framework of the international airport, it is necessary to complete the construction of the runway. To complete it, we need UAH 360 million. What are we doing in this direction? A certain land plot has been transferred to the city. We are now very actively working with the private investor who is seriously considering the construction of the international airport within a public-private partnership. The idea is even to make a cargo hub here to unload Kyiv, the Zhuliany and Boryspil airports, to make a hub here to fly here and send cargo across Ukraine,” he said in an exclusive interview with Interfax-Ukraine.
Speaking about road construction, Bunechko said that since the beginning of his work as head of the regional administration in August 2019, he was skeptical about whether the Chinese contractors would be in due time with the construction of a ring road around Zhytomyr, since they violated all the deadlines.
“But the pace with which they are now making the road, and the kilometers of the road that are already there, all this gives hope and optimism,” he said.
Bunechko said that the region now has a new approach to regional roads, and not “patching up” roads.
“When I reported to the president about my first 100 days of work, I said that there would be 90 km of roads, he asked: “Are you going to build roads in 10 years?” We have a network of 7,000 km. He said that we need to look for opportunities. I want to say today it is 140 km of regional roads, which are already being repaired, despite all the obstacles that were in the antimonopoly committee. We have overcome them, we have completely tendered all our 53 highway points, all roads are being repaired. There are some roads that have already been completed, now they will be put into operation, it remains to obtain permits,” he said.
The governor said that the most critical sections of roads were selected throughout Zhytomyr region, and soon everyone will feel that the roads are being built.
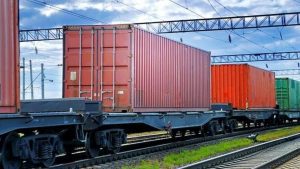
The ninth container train from the Chinese city of Nanchang arrived at the Kyiv-Lisky station, the press service of Ukrzaliznytsia said on Saturday.
Three more trains from China are expected throughout September, according to the company.
Ukrzaliznytsia notes that the arriving train includes 41 containers with mineral fertilizers, light industry goods, lamps, bulbs, chemical components for water filtration and less-than-car load. In addition, the train delivered medical supplies to Ukraine, in particular, masks and other protective equipment.
The distance of transportation, which is more than 9,000 km along the territories of four countries, are covered by China trains during 15 days on average.
As reported, direct container shipments from China to Ukraine began on June 8, 2020.