
In December 2025, Ukraine exported 10.38 thousand tons of dairy products worth $25.92 million, which is 0.3% and 6% less than in November, but 44% and 51% more than in December 2025, according to the Association of Milk Producers (AMP).
The industry association noted that in January-December 2025, Ukraine exported 131.91 thousand tons (+12% compared to the same period in 2024) of dairy products worth $401.36 million (+35%).
Analysts specified that the main export categories in December were milk and condensed cream (36%), cheese (22%), and butter (21%).
According to their information, in December 2025, Ukraine increased the volume of exports of milk and cream, not condensed, to 2.58 thousand tons (+13%), milk and cream, condensed, to 3.63 thousand tons (+5%), fermented milk products to 575 tons (+14%), butter to 836 tons (+13%), and ice cream to 336 tons (+6%) compared to November. The volume of whey exports decreased to 1 thousand tons (-22%) and cheese to 1.24 thousand tons (-3%) compared to the previous month.
Compared to December 2024, Ukraine increased its physical exports of milk and cream, condensed (+90%), fermented milk products (+50%), butter (+91%), and cheese (+45%) to foreign markets the most.
At the same time, compared to November 2025, cash proceeds for shipped milk and cream, non-condensed, increased to $2.09 million (+11%), milk and cream, condensed, to $9.23 million (+5%), fermented milk products to $984 thousand (+32%), ice cream to $1.29 million (+10%), butter to $5.41 million (+7%), but decreased for shipped whey to $1.11 million (-23%) and cheese to $5.8 million (-5%).
Compared to December 2024, the largest increase in cash proceeds was for exported milk and cream, condensed (+68%), fermented milk products (+78%), and butter (+60%). Cash proceeds for exported whey decreased (-5%).
“The unpredictable increase in milk production during 2025 led to an accumulation of exchange goods in European warehouses and a collapse in world prices for butter and other dairy products. Activity in the dairy market traditionally slows down at the end of the year, during the New Year holidays, which naturally led to a reduction in exports from Ukraine. In early January, exports of dairy products from Ukraine to Europe effectively stopped due to changes in EU requirements for licensing export volumes within quotas. The procedure, developed at the end of December, was not actually provided to anyone, which meant that Ukrainian processing companies, together with their partners who import Ukrainian dairy products, were unable to submit applications for export permits in a timely manner,” explained AVM analyst Georgiy Kukhiashvili.
The industry association drew attention to the increase in imports of dairy products from the EU to Ukraine, in particular cheese and butter, which are supplied to domestic retail chains from Poland. In December 2025, the country imported 6.52 thousand tons of dairy products worth $37.28 million. Compared to November 2025, natural import volumes increased by 17%, and compared to December 2024, they decreased by 14%.
In January-December 2025, Ukraine imported 64.69 thousand tons (+7%) of dairy products worth $337.93 million (+16%). Cheese accounted for the largest share of total imports during this period (65%).
“The foreign trade balance in December was negative and amounted to -$11.36 million, probably due to the influx of cheap condensed milk and cheese into Ukraine and a decrease in the volume of dairy product exports,” the AVM summarized.
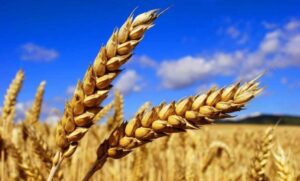
The US Department of Agriculture (USDA) has reduced its forecast for wheat exports from Ukraine in the 2025-2026 marketing year (MY) from 14.5 million tonnes to 14 million tonnes (-0.5 million tonnes or 3.4%) given the increase in domestic consumption from 7.6 million tonnes to 8.1 million tonnes (+0.5 million tonnes or 6.6%), the forecast for corn remained unchanged.
The global forecast for wheat for 2025/26 calls for increased supplies, consumption, trade, and ending stocks. (…) Global consumption increased by 0.9 million tonnes to 823.9 million tonnes, mainly due to increased use in Russia, Ukraine, and Morocco, according to the USDA’s December report.
The US Department of Agriculture has not changed its estimate of Ukraine’s wheat harvest to 23 million tonnes, with exports at 14 million tonnes (-0.5 million tonnes) and ending stocks at 1.93 million tonnes. At the same time, it is noted that domestic consumption will increase to 8.1 million tonnes (+0.5 million tonnes or 6.6%).
USDA analysts left unchanged their forecast for corn harvest in Ukraine in 2025/26 MY — 29 million tonnes, exports — 23 million tonnes, ending stocks — 0.85 million tonnes.
The USDA has increased its forecast for global wheat production in 2025/26 MY to 842.17 million tonnes (+4.36 million tonnes), global exports to 219.76 million tonnes (+1.05 million tonnes), and ending stocks — 278.25 million tonnes (+3.38 million tonnes).
The USDA has raised its forecast for global corn production in 2025/26 MY to 1,296.01 million tonnes (+13 million tonnes), exports to 205.1 million tonnes (+0.01 million tonnes), and ending stocks to 290.91 million tonnes (+11.76 million tonnes).

Imports of goods to Ukraine in January-December 2025 amounted to $84.8 billion in monetary terms, while in the previous year this figure was 20% lower at $70.7 billion, according to data from the press service of the State Customs Service of Ukraine (SCS).
According to the publication, exports of goods, on the contrary, decreased from $41.6 billion in 2024 to $40.3 billion in 2025.
“Taxable imports amounted to $64.3 billion, which is 76% of the total volume of imported goods. The tax burden per 1 kg of taxed imports in January-December 2025 amounted to $0.52/kg,” the SCS noted in its report on trade turnover in 2025.
During 2025, the top three countries from which Ukraine imported the most goods remained almost unchanged: China – $19.2 billion, Poland – $7.9 billion, and Germany – $6.6 billion.
During the year, Ukraine exported the most to Poland – $5 billion, Turkey – $2.7 billion, and Germany – $2.4 billion.
In terms of the total volume of goods imported in 2025, the largest share was accounted for by machinery, equipment and transport – $34.1 billion (with customs clearance, UAH 207.8 billion was paid to the budget, or 29% of customs revenue), chemical industry products – $12.5 billion (97.8 billion hryvnia paid to the budget, accounting for 14% of customs revenue), fuel and energy – $10.5 billion (214.8 billion hryvnia paid, or 30% of customs revenue).
As in the previous year, the top three most exported goods from Ukraine were food products – $22.5 billion, metals and metal products – $4.7 billion, and machinery, equipment and transport – $3.6 billion.
The State Customs Service added that in January-December 2025, during customs clearance of exports of goods subject to export duties, UAH 1.53 billion was paid to the budget, which is significantly more than in 2024, when UAH 311.3 million was received by the budget.
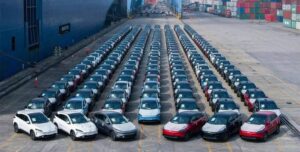
Retail sales of passenger cars in China in 2025 increased by 3.9% – the slowest pace in three years, according to the China Passenger Car Association (CPCA). In 2024, sales growth was 5.3%.
Sales of electric vehicles and plug-in hybrids rose 17.6% last year after jumping 40.7% a year earlier. At the same time, annual sales of such vehicles in the country exceeded sales of traditional vehicles for the first time.
Car exports from China rose 19.4% last year to 5.79 million units. Exports of electric vehicles jumped 48.8% to 1.52 million units, the CPCA reported.
Domestic demand for new energy vehicles (NEVs) in China declined after subsidies for buyers were reduced or discontinued in many cities and provinces across the country.
According to the CPCA forecast, car sales in China will remain at 2025 levels in 2026, and the growth rate of electric vehicle exports will slow down.
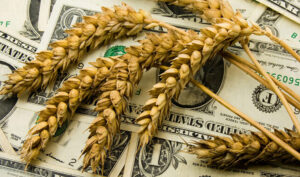
According to the results of 2025, Ukraine exported agricultural products worth $22.53 billion, which is 8.8%, or $2.15 billion, less than the previous year, according to the Ukrainian Agribusiness Club (UAC).
The association noted that despite the decrease in foreign exchange earnings, the share of the agro-industrial complex in the overall structure of goods exports in 2025 was 56.1%.
“Although this percentage has declined slightly compared to the record year of 2023, when agricultural products accounted for 61% of total exports, the industry continues to generate more than half of the country’s foreign trade revenues,” analysts emphasized.
The most noticeable trend was a reduction in agricultural exports to the European Union. While in 2022-2024 the EU’s share in the structure of Ukrainian agricultural exports consistently exceeded 50%, in 2025 it fell to 47.5% ($10.7 billion), according to statistics.
Some of the factors influencing this are changes in logistics routes and tighter regulatory restrictions on the European market. There has also been a general decline in trade dynamics, namely: the balance with the EU fell to $6.06 billion compared to $8.87 billion in 2024, analysts noted.
They emphasized that against the backdrop of declining export revenues, there is a reverse trend in the import segment. In 2025, purchases of foreign agricultural products rose to a record $8.75 billion over the past five years.
“Although the share of agricultural products in Ukraine’s total imports has remained stable over the past four years at around 10.8%, in absolute terms, spending on food imports is growing every year. At the same time, in 2025, more than 53% of all agricultural imports ($4.64 billion) came from European Union countries, which underscores the deep integration of Ukraine’s consumer market with the European market,” the UACB concluded.

The Cabinet of Ministers of Ukraine has maintained zero quotas for the export of natural gas of Ukrainian origin in 2026, according to Government Resolution No. 1795 of December 31 on the list of goods whose export and import are subject to licensing and quotas.
According to the document, exports of natural gas of Ukrainian origin in 2026 will continue to be subject to quotas, with the quota set at zero.
The resolution is published on the government’s website.