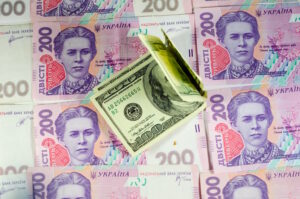
The Experts Club analytical center has presented a new short video dedicated to changes in the composition of the world’s 20 largest economies by gross domestic product calculated at purchasing power parity. The analysis shows a gradual shift in the center of the global economy from North America and Western Europe toward Asia, as well as the strengthening of large developing countries with large populations and growing domestic markets.
According to Experts Club calculations based on the International Monetary Fund’s April World Economic Outlook database, China remains the world’s largest economy by GDP at PPP in 2026. Its figure is estimated at $44.3 trillion in international dollars. The United States ranks second with $32.4 trillion, followed by India in third place with $18.9 trillion. Russia ranks fourth at about $7.5 trillion, Japan fifth at $7.3 trillion, and Germany sixth at $6.4 trillion. They are followed by Indonesia, Brazil, France and the United Kingdom. The second ten of the world’s largest economies includes Türkiye, Italy, Mexico, South Korea, Spain, Canada, Saudi Arabia, Egypt, Nigeria and Taiwan.
The figures cited are IMF estimates for 2026 rather than final annual results. The full World Economic Outlook database was published in April 2026 and contains statistical data and forecasts through 2031.
At the beginning of the 1990s, the structure of the global economy looked significantly different. In 1992, the United States ranked first, Japan second and Germany third. China was only in sixth place, India ninth and Indonesia 14th. By 2026, China had risen to first place, India to third and Indonesia to seventh. South Korea moved from 18th place in 1992 to 14th, while Türkiye moved from 15th to 11th.
The growth of Asian countries is associated with population growth, urbanization, expansion of industrial production, infrastructure development and the formation of large domestic consumer markets. China’s rise has been particularly notable. In 1992, its economy at PPP was almost five times smaller than that of the United States, whereas today China’s figure is roughly one-third higher than the U.S. figure. India has also significantly narrowed the gap with the world’s largest economies. Its GDP at PPP in 2026 is almost three times that of Japan or Germany.
Western European countries remain widely represented among the world’s largest economies, but their relative positions are gradually declining. Germany moved from third place in 1992 to sixth in 2026. Italy fell from fifth to 12th, France from seventh to ninth, and the United Kingdom from eighth to tenth. The Netherlands, which was among the top 20 in the early 1990s, subsequently dropped out. Australia has also periodically ranked among the top 20 but is currently outside it.
This trend does not mean an absolute contraction of European economies. Their GDP continues to grow, but the economies of Asia, the Middle East and individual African countries are expanding faster. GDP at PPP additionally strengthens the positions of developing countries because it takes differences in domestic prices into account. One international dollar is intended to represent a comparable amount of goods and services across different economies, regardless of the market exchange rate of the national currency.
One of the important trends of recent decades has been the strengthening of major African countries. Egypt ranks 18th in the IMF’s 2026 estimate with GDP at PPP of about $2.57 trillion, while Nigeria ranks 19th with $2.42 trillion. Their presence in the top 20 is primarily related to the size of their populations and domestic markets. At the same time, high aggregate GDP does not automatically mean a high standard of living for citizens. To assess living standards, GDP at PPP per capita, labor productivity, the structure of the economy, income distribution and the quality of public services must be considered separately.
Following the collapse of the USSR, Ukraine remained among the world’s 20 largest economies by GDP at PPP for some time. According to Experts Club calculations based on the IMF’s historical data series, Ukraine ranked 17th in 1992 with about $433 billion in international dollars. In 1993, it ranked 19th, while in 1994 it fell to 23rd place and finally left the top 20.
In 2000, Ukraine ranked approximately 35th, in 2010 it was 31st, and on the eve of the full-scale war, in 2021, it ranked around 34th. Following the sharp contraction of the economy in 2022, Ukraine fell to 47th place. The World Bank estimated the decline in Ukraine’s real GDP in 2022 at approximately 29%. In subsequent years, the economy partially recovered. According to the IMF estimate, Ukraine ranked approximately 46th in 2025 and may rise to 44th place in 2026. Ukraine’s GDP at PPP in 2026 is estimated at approximately $724.5 billion in international dollars. This is about 0.33% of the global economy. Ukraine is positioned between Chile and Austria, ahead of Peru, the Czech Republic, Iraq and Norway.
“Ukraine’s departure from the top 20 did not occur in recent years, but back in the first half of the 1990s. Since then, the world has changed significantly: China, India, Indonesia, Türkiye and other developing countries expanded their industries, infrastructure and domestic consumption, while Ukraine went through prolonged structural crises, population loss and insufficient investment,” said Maksym Urakin, founder of the Experts Club analytical center.
According to him, the full-scale war further widened the gap between Ukraine and the world’s largest economies due to the destruction of enterprises, energy facilities and transport infrastructure, as well as the reduction in labor resources. As of the end of 2025, direct damage to Ukraine was estimated at more than $195 billion, while recovery and reconstruction needs for the next decade were estimated at nearly $588 billion.
The world’s 20th-largest economy, Taiwan, has GDP at PPP of about $2.27 trillion. This is more than three times Ukraine’s figure. Therefore, Ukraine cannot return to the top 20 through short-term post-war recovery alone. This will require sustained productivity growth, increased investment, the return of part of the population, development of the manufacturing industry and expansion of exports of high value-added products.
“The main conclusion from the ranking lies not in the country’s position itself, but in the speed of its movement relative to other countries. Even growth of several percent per year may be insufficient if competitors are growing faster. Ukraine needs a model of accelerated development designed for at least two decades,” Urakin emphasized.
Experts Club notes that GDP at PPP rankings make it possible to assess the scale of national economies and their role in global production, but they should not be used as the sole indicator of economic success. The United States, for example, trails China in aggregate GDP at PPP but significantly outpaces it in GDP per capita, financial market development and the value of high-tech companies.
The main global trend remains the gradual shift of economic weight toward Asia and the countries of the Global South. In the coming decades, this process will be supported by demographic growth, urbanization and the expansion of the middle class in India, Indonesia, Africa and other developing regions.
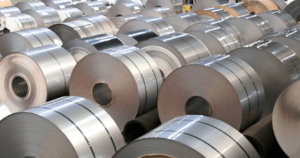
Global demand for steel in 2025 will remain at the previous year’s level — about 1.748 billion tons, after a 1.6% decline in 2024. These figures are given in the short-term forecast of the World Steel Association (Worldsteel) — Short Range Outlook (SRO).
In 2026, according to experts, demand will grow by 1.3% to 1.772 billion tons, driven by recovery in Europe, India, and the rapidly developing countries of Asia, the Middle East, and Africa.
According to Worldsteel’s forecast, in the CIS countries, including Ukraine, demand for steel will decline by 5.2% in 2025, to 56.1 million tons, and by another 1.7% in 2026, to 55.2 million tons.
At the same time, India will retain its status as the world’s fastest-growing steel market, with growth of around 9% annually in 2025-2026. Already next year, steel consumption in India will be almost 75 million tons higher than in 2020.
In developing countries (excluding China), demand for steel will increase by 3.4% in 2025 and by 4.7% in 2026, driven by active economic development in ASEAN countries, as well as in Saudi Arabia and Egypt.
In Africa, steel consumption is growing by an average of 5.5% annually, reaching 41 million tons in 2025 — the highest level in the last decade. Growth is driven by investments in construction and improved macroeconomic indicators.
Andriy Ozeychuk, Chairman of the Board of Directors of the Ukrainian Steel Construction Center and Director of Rauta, commented on the market situation and prospects for the Ukrainian steel sector.
“The Ukrainian steel market in 2025–2026 will be shaped by the recovery of domestic demand in construction and machine building, as well as the growth of exports of metal structures to the EU. We predict that demand for steel in Ukraine may grow by 6-8% in 2026 due to infrastructure and industrial recovery projects,” Ozeychuk said.
According to him, the steel construction sector will be the driver of this growth:
“The use of metal structures will accelerate the restoration of logistics, industrial, and infrastructure facilities.”
Ozeychuk also stressed that the launch of joint programs with European partners in the field of “green” metallurgy, where Ukraine already has its first pilot initiatives for the production of steel with a low carbon footprint, could give the industry an additional boost.
According to the forecast, demand for steel in the EU+UK region will increase by 1.3% in 2025 and by 3.2% in 2026. This reflects the impact of increased investment in infrastructure and defense amid lower inflation and improved household incomes.
In the US, Worldsteel expects steel consumption to increase by 1.8% in both 2025 and 2026. The main drivers of growth will be government spending on infrastructure, a revival in housing construction, and private investment.
In China, steel demand will continue to decline, by approximately 2% in 2025, due to the prolonged downturn in the real estate market. In 2026, the rate of decline will slow to 1% as the construction sector is expected to bottom out.
Worldsteel warns that a more challenging global trade environment and financial pressure on local authorities could further limit infrastructure investment and reduce demand.
According to Alfonso Hidalgo de Calcerrada, chief economist of the Spanish Steel Manufacturers Association (UNESID) and chairman of the Worldsteel Economic Committee, the organization is “cautiously optimistic” about the market outlook:
“Despite trade disputes and uncertainty, we believe that global steel demand will bottom out in 2025 and show moderate growth in 2026,” the expert said.
He added that this will be facilitated by the resilience of the global economy, growth in infrastructure investment, and easing financial conditions. At the same time, the sector continues to be pressured by high costs, trade barriers, and geopolitical risks.
Worldsteel’s forecast emphasizes that the decline in demand in China is offset by strong growth in India and developing countries, where a new center of global steel production is emerging.
In addition, the protective measures introduced by the European Union — reducing duty-free import quotas and increasing customs duties to 50% — may change the balance between EU producers and exporters from Asia and Eastern Europe.
For more information on the largest steel producers and global industry trends, see the Experts Club video analysis review available on YouTube: Experts Club — Leaders of the global steel industry 1990–2024
CHINA, EU, EXPERTS CLUB, global economy, INDIA, OZEYCHUK, RAUTA, USA, World Steel, WORLDSTEEL