In the next video YouTube-channel of the analytical center “Club of experts” the prospects of trade and economic relations between Ukraine and Egypt were considered.
As the founder of the Club of Experts Maxim Urakin emphasized, before the war Egypt was the most favorable trade partner for Ukraine, the trade surplus with which amounted to almost 2 billion U.S. dollars. Grain and metallurgical products were the main Ukrainian goods at the Egyptian market.
At the same time, in the first months of the war, the Russian blockade of maritime communications in the Black Sea limited Ukrainian exports to Africa and, above all, to Egypt. The grain agreement improved the situation, but only with regard to agricultural exports. In order not to lose the Egyptian market, the Ukrainian companies have to adapt to the current situation now in order not to make additional efforts after the war.
According to the President of the Ukrainian Exporters Club Eugenia Litvinova, the Ukrainian producers should pay attention to the Egyptian market of dairy products in the first place. In this case, it is necessary to take into account the separation of Egyptian groups of goods for wholesale and retail trade while creating favorable conditions for imports. Also, according to her, the demand in Egypt is for canned and dried fruits, confectionery, chocolate, oils, fats, mineral water, as well as crockery, various cutlery, baths, showers, sinks, building materials and other goods for the retail trade.
“I want to draw attention to the fact that all Ukrainian exporters who want to trade with Egypt, must be registered in the general administration to control exports and imports. After that it is possible to establish logistics through rail and road ways, taking into account the temporary inaccessibility of the port of Odessa”, – she explained.
Besides, Yevgeniya Litvinova noticed that since March of the last year, Egypt obliged Ukraine to use the letter of credit for many groups of goods that leads to rise in price of transactions from 0,2 to 0,5%. This factor, according to the expert, will also directly affect trade and its final results.
“If we talk about advice to our small and medium-sized businesses when entering the Egyptian market, first you need to understand what exports are, if you have not previously been involved in this process. Then you should analyze in which cases it is profitable to open a Ukrainian enterprise in Egypt to work, and in which cases you do not always need to do it and not always profitable. Finally, the third tip – go through the registration. At least look at how to pass authorization, registration through a single window in Egypt. I draw your attention to the fact that your brand should be registered at least in Ukraine before you start to pass this registration in Egypt, “- summed up Eugenia.
In turn, the head of the Egyptian diaspora in Ukraine, Dr. Atia Walid noticed that in recent years Egyptian-Ukrainian trade relations have been intensively developed and our country has been invited to participate in major infrastructure projects, which are now being implemented by the Egyptian authorities.
“Back in 2021 Egypt discussed with the Ukrainian government investment in the special economic zone of the Suez Canal. That is, the Egyptian economic policy is primarily aimed at encouraging investment in the country’s economy. Egypt, of course, is interested in cooperation with Ukrainian companies from the point of view of opening joint ventures on its territory, which can well be realized today, despite the war. I think it is quite realistic for Ukrainian companies to open branches there, if they are interested in the sales market. Egypt is ready to facilitate this,” stressed the representative of Egypt.
In his opinion, our suppliers should work more actively both with the Egyptian embassy in Kiev and the Ukrainian embassy in Cairo. This will facilitate the passage of bureaucratic procedures and reduce the likelihood of becoming victims of fraud.
“Ukrainian businessmen should check with the Egyptian embassy or the Chamber of Commerce the authenticity of the documents of those organizations with which they cooperate. And only after that, conclude a contract according to all international rules. You should not believe the promises and pretty eyes, and do not forget the basics of doing business in the field of export-import. I wish all businessmen in Egypt and in Ukraine only success,” said Dr. Atia Walid.
See more details in the video:
You can subscribe to the Club of Experts channel by following the link:
ATIA_VALID, BUSINESS, CLUB_EXPERTS, CLUB_EXPORTERS, EGYPT, EXPORT, GOODS, IMPORT, LITVINOVA, TRADE, UKRAINE, URAKIN
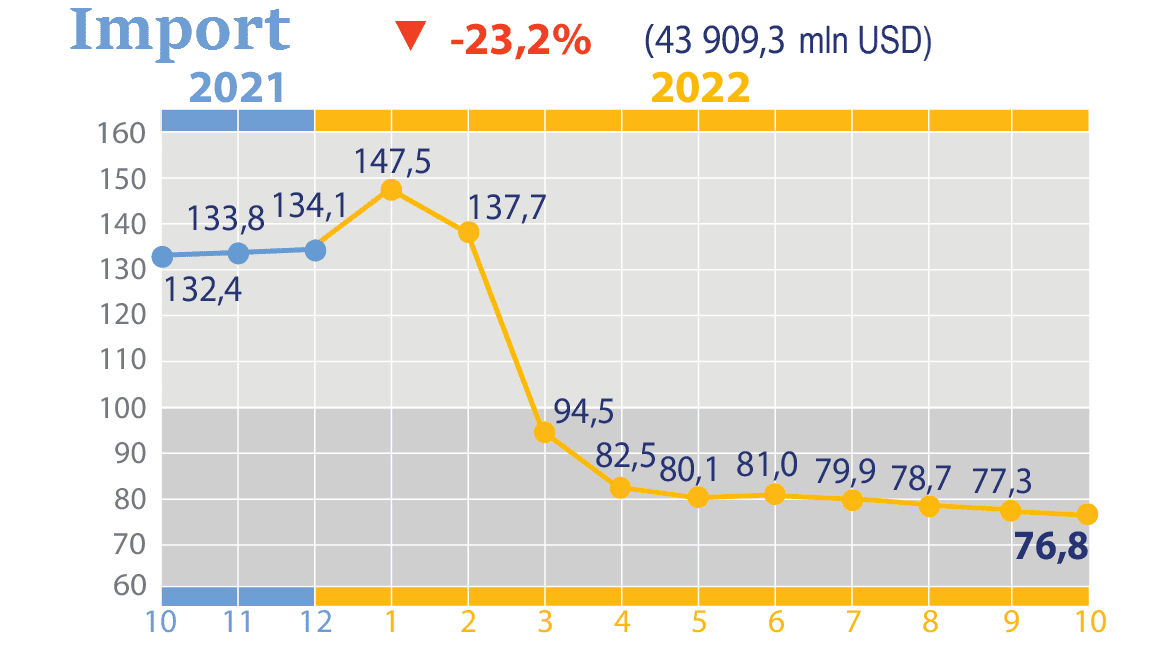
Import changes in % to previous period in 2021-2022

Source: Open4Business.com.ua and experts.news
Import of goods in Jan-Oct 2022 in most important positions and in relation to same period in 2021

Source: Open4Business.com.ua and experts.news

Ukraine in 2022 decreased imports of aluminum ores and concentrate (bauxite) in volume terms by 81.5% compared to the previous year – up to 945.396 thousand tons, in November-December the import was not carried out.
According to statistics released by the State Customs Service (SCS), imports of bauxite in monetary terms fell by 79.6% during this period – to $48.166 million.
At the same time imports were carried out mainly from Guinea (58.90% in monetary terms), Brazil (27.19%) and Ghana (7.48%).
Ukraine did not re-export bauxite in 2022.
As reported, Ukraine in 2021 decreased imports of aluminum ore and concentrate (bauxite) in volume terms by 0.1% compared to 2020 – to 5 million 114.227 thousand tons. Imports of bauxite in monetary terms increased by 4.2% to $236.638 million.
Imports were carried out mainly from Guinea (59.33% of supplies in monetary terms), Brazil (21.33%) and Ghana (16.8%).
Ukraine in 2021 re-exported 277 tons of bauxite worth $70 thousand to Belarus (48.57%), Poland (40%) and Russia (7.14%), while in 2020 was re-exported to Poland 255 tons of bauxite worth $41 thousand.
Bauxite is an aluminum ore used as a raw material for producing alumina, and from it, aluminum. They are also used as fluxes in iron and steel industry.
Bauxite is imported into Ukraine by the Nikolaev Alumina Refinery (NGR), which before the war was affiliated with the United Company (UC) Russian Aluminum (RusAl, RF). Bauxite is used to produce alumina.
“RusAl in Ukraine also previously owned a stake in the Zaporozhye Aluminum Plant (ZALK), which stopped producing primary aluminum and alumina.
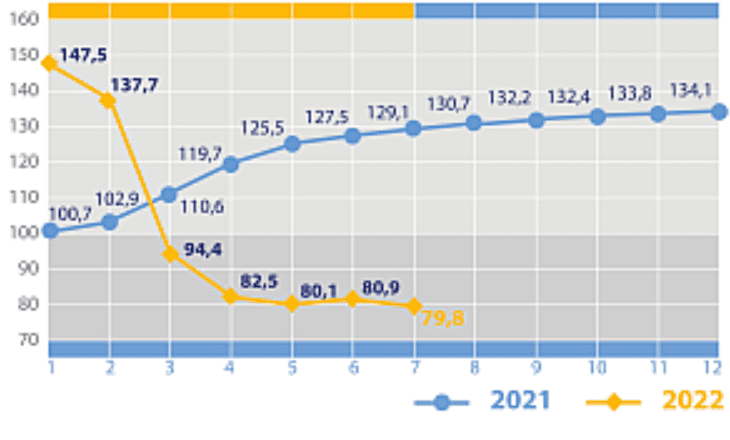
Import of goods to Ukraine in % to previous period in 2021 and 2022

SSC of Ukraine

Ukrainian President Volodymyr Zelensky has signed laws No. 8196/8197 on assistance in restoring Ukraine’s energy infrastructure, which, in particular, cancel VAT and customs duties on imports of generators and other power equipment, as well as Starlink satellite systems for the period until May 2023.
As people’s deputy Yaroslav Zheleznyak (faction “Voice”) wrote in his Telegram channel, the laws will come into force three days after publication, according to his calculations, January 2-3, 2023.
“Of the main innovations: the importation of generators, other equipment, Starlink without duty and VAT is introduced at the legislative level. Including for individuals. The norm will be valid until May 2023,” – wrote Zheleznyak.
As it was reported, the Verkhovna Rada passed the bills № 8196/8197 in the second reading on December 13.
The bills also exempt from VAT and duties on importation of equipment within the framework of technical assistance, mail and express consignments, and provide the opportunity to store fuel without a license in the amount of up to 2,000 liters, and more than this volume on the conditions of notification to the tax authorities on the declarative principle.
As previously reported by the head of the Verkhovna Rada Committee on Finance, Tax and Customs Policy Daniel Hetmantsev, the purpose of the above bills is to introduce short-term incentive tax and customs incentives for the restoration of energy infrastructure.