
According to Experts Club, Egypt has the highest level of positive sentiment among Ukrainians among the North African countries included in the study: 28.2% of respondents view it positively, and the net positive rating stands at 21.4 percentage points. At the same time, neutral assessments dominate perceptions of all four countries in the region—their share ranges from 59.3% to 67.3%. This is evidenced by the results of the third wave of the study “Ukrainians’ Attitudes Toward Countries Around the World,” conducted by Active Group in collaboration with Experts Club, reports the Experts Club Information and Analytical Center.
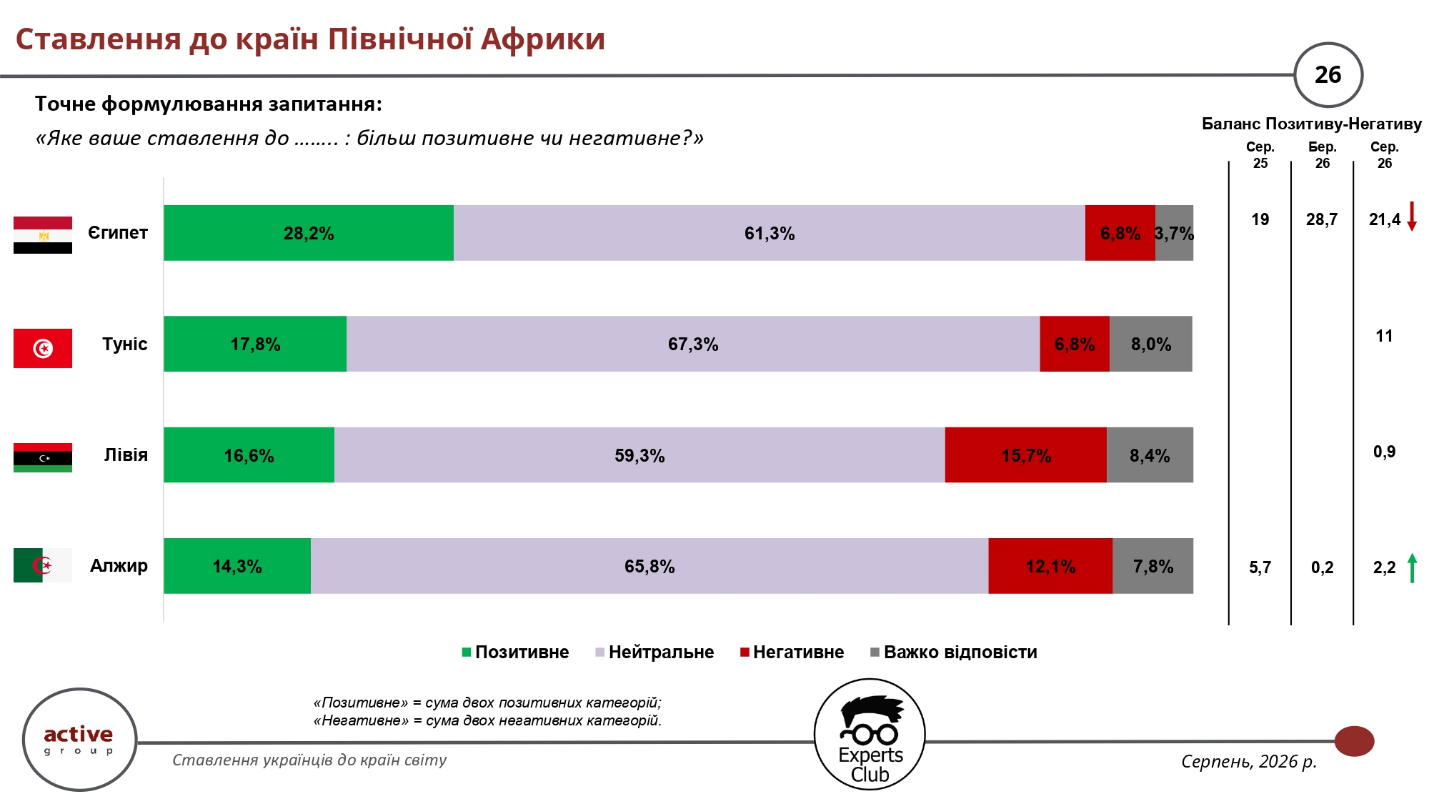
28.2% of Ukrainians surveyed view Egypt positively, 61.3% neutrally, 6.8% negatively, and another 3.7% were undecided. The balance of positive and negative assessments in August 2026 stood at 21.4 percentage points, compared to 28.7 percentage points in March and 19 percentage points in August 2025. Thus, following a spring increase, the indicator has declined but remains slightly higher than it was a year ago.
Neutral attitudes toward Tunisia predominate—67.3% of respondents expressed this view. 17.8% view the country positively, 6.8% negatively, and another 8% were undecided. The balance stands at plus 11 percentage points, placing Tunisia in second place among the North African countries surveyed.
In Libya, positive and negative assessments are virtually equal: 16.6% of respondents view the country positively, 15.7% negatively, and 59.3% neutrally. Accordingly, the balance is only +0.9 percentage points.
For Algeria, the share of positive assessments is 14.3%, negative—12.1%, neutral—65.8%, and another 7.8% of respondents were undecided. The balance stands at plus 2.2 percentage points. In March 2026, it was only plus 0.2 percentage points, and in August 2025, it was plus 5.7 percentage points.
Thus, none of the North African countries surveyed has a negative sentiment balance; however, the high proportion of neutral responses indicates that Ukrainians’ attitudes toward these countries are significantly less well-defined compared, for example, with their attitudes toward European countries. At the same time, Egypt and Algeria are also economically important to Ukraine: according to data presented at the press conference, in the first half of 2026, Ukraine’s trade surplus with Egypt amounted to $527.1 million, and with Algeria—$309.2 million.
Maksym Urakin, founder of the Experts Club Information and Analytical Center, deputy director of the Interfax-Ukraine news agency, and candidate of economic sciences, emphasized the need for partner countries to communicate more actively with the Ukrainian audience.
“The first recommendation is to regularly highlight specific projects, concrete actions, and the presence here of foundations, embassies, teams, and diplomats in the humanitarian sphere and in science. Second, to be open to questions and inquiries from the media and the public,” Urakin noted. According to him, it is also advisable to use sociological survey results to strengthen bilateral relations, particularly in the trade sector.
The survey was conducted in August 2026 using self-administered online questionnaires in the SunFlowerSociology panel among 800 Ukrainian citizens aged 18 and older. According to the organizers, the sample is representative in terms of age, gender, and region, with a maximum theoretical margin of error of ±3.5 percentage points. This is the third wave of the study, following surveys conducted in August 2025 and March 2026.
ACTIVE GROUP, ALGERIA, EGYPT, EXPERTS CLUB, international relations, LIBYA, NORTH AFRICA, SOCIOLOGY, TUNISIA, UKRAINE
According to Experts Club, Turkey has the highest net positive sentiment among Ukrainians among the Middle Eastern countries included in the study—44.9 percentage points. More than half of those surveyed—52.3%—view the country positively. At the same time, neutral attitudes prevail toward Saudi Arabia and Jordan, while Lebanon is the only country in this group with a negative balance. This is evidenced by the results of the third wave of the study “Ukrainians’ Attitudes Toward Countries Around the World,” conducted by Active Group in collaboration with Experts Club, according to the Experts Club Information and Analytical Center.
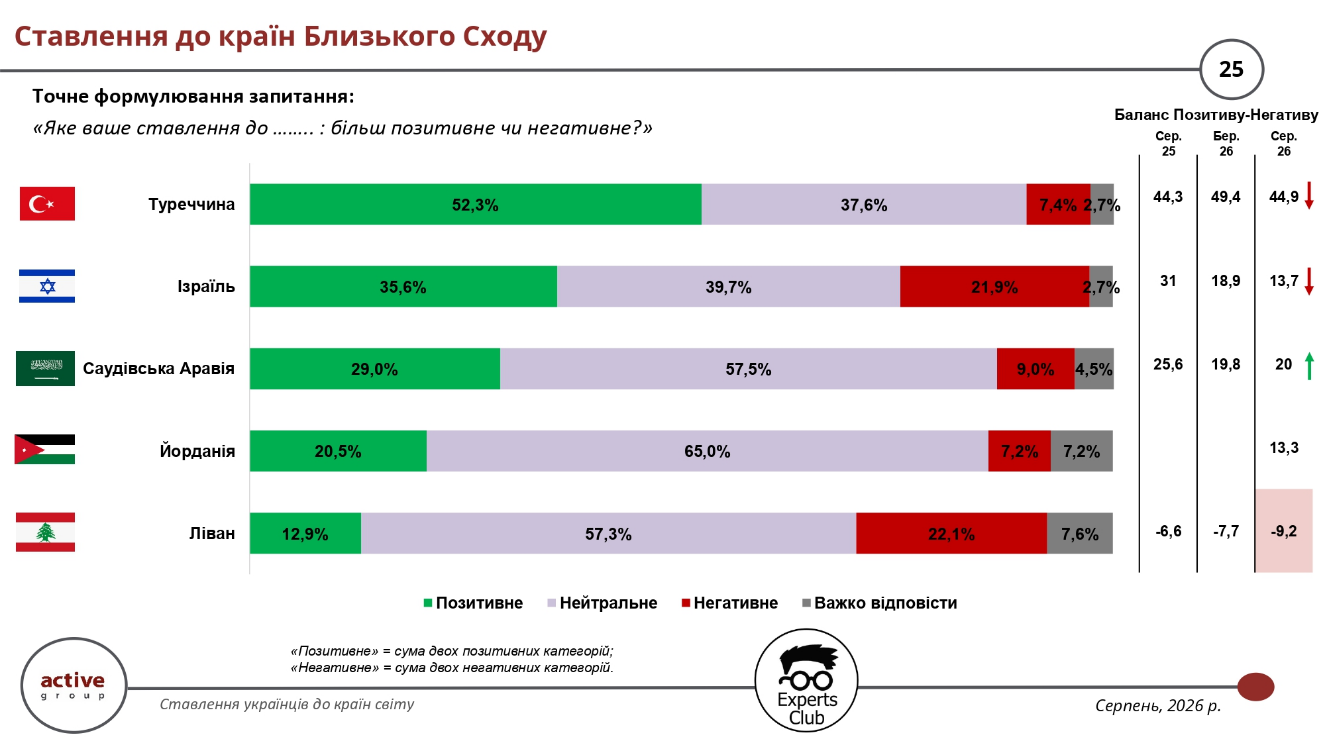
52.3% of respondents view Turkey positively, 37.6% neutrally, 7.4% negatively, and another 2.7% were undecided. The balance of positive and negative assessments stands at 44.9 percentage points, compared to 49.4 percentage points in March 2026 and 44.3 percentage points in August 2025. Thus, following a spring increase, the indicator has returned to roughly last year’s level.
Israel ranks second among the countries shown on the slide in terms of the share of positive assessments—35.6%. 39.7% of respondents view it neutrally, 21.9% negatively, and another 2.7% were undecided. The balance stands at 13.7 percentage points and continues to decline: in August 2025, it was 31 percentage points, and in March 2026, it was 18.9 percentage points.
Saudi Arabia is viewed positively by 29% of Ukrainians, while the majority—57.5%—hold a neutral stance. The share of negative assessments is 9%, and the balance is +20 percentage points, compared to 19.8 percentage points in March. Compared to August 2025, when it stood at 25.6 percentage points, the figure remains lower.
Regarding Jordan, 65% of respondents hold a neutral stance—the highest figure in this regional group. 20.5% of those surveyed view the country positively, 7.2% negatively, and another 7.2% are undecided. The balance of positive and negative assessments stands at 13.3 percentage points.
Lebanon has the lowest score. 12.9% of Ukrainians view the country positively, 22.1% negatively, and 57.3% neutrally. The balance stands at minus 9.2 percentage points and is gradually deteriorating: from minus 6.6 percentage points in August 2025 to minus 7.7 percentage points in March and minus 9.2 percentage points in August 2026.
Maksym Urakin, founder of the Experts Club information and analytical center, emphasized the importance of foreign governments maintaining constant communication with the Ukrainian public.
“The first recommendation is to regularly showcase specific achievements and concrete actions. Second, be open to questions and inquiries from the media and the public,” Urakin noted. He also recommended that diplomatic missions systematically inform Ukrainians about the concrete results of cooperation.
Oleksandr Pozniy, director of the research company Active Group, drew attention to the need to combine an information presence with the practical development of bilateral relations.
“We should focus not only on raising general awareness. First and foremost, business associations, the Ministry of Economy, and the Ministry of Foreign Affairs need to take action,” Pozniy noted.
In his view, economic and diplomatic institutions should more actively tap into the potential of markets where Ukraine can expand its cooperation.
Overall, the study shows that Ukrainians’ perceptions of Middle Eastern countries vary significantly. Turkey has a distinctly positive image, while neutrality dominates perceptions of Saudi Arabia and Jordan; assessments of Israel are more polarized, and negative assessments of Lebanon outweigh positive ones.
The survey was conducted in August 2026 using self-administered online questionnaires in the SunFlowerSociology panel among 800 Ukrainian citizens aged 18 and older. According to the organizers, the sample is representative by age, gender, and region, and the maximum theoretical statistical margin of error is 3.5%. This is the third wave of the study, following surveys conducted in August 2025 and March 2026.
ACTIVE GROUP, EXPERTS CLUB, ISRAEL, JORDAN, LEBANON, MIDDLE EAST, SAUDI ARABIA, SOCIOLOGY, TURKEY, UKRAINE
According to Experts Club, most countries in South and Southeast Asia are characterized by a high proportion of neutral attitudes among Ukrainians—ranging from 48.3% for India to 68.9% for Malaysia. Thailand received the highest proportion of positive assessments among the countries surveyed—30.9%—while India is the only country in the group with a distinctly negative balance of attitudes. This is evidenced by the results of the third wave of the study “Ukrainians’ Attitudes Toward Countries Around the World,” conducted by Active Group in collaboration with Experts Club, reports the Experts Club Information and Analytical Center.
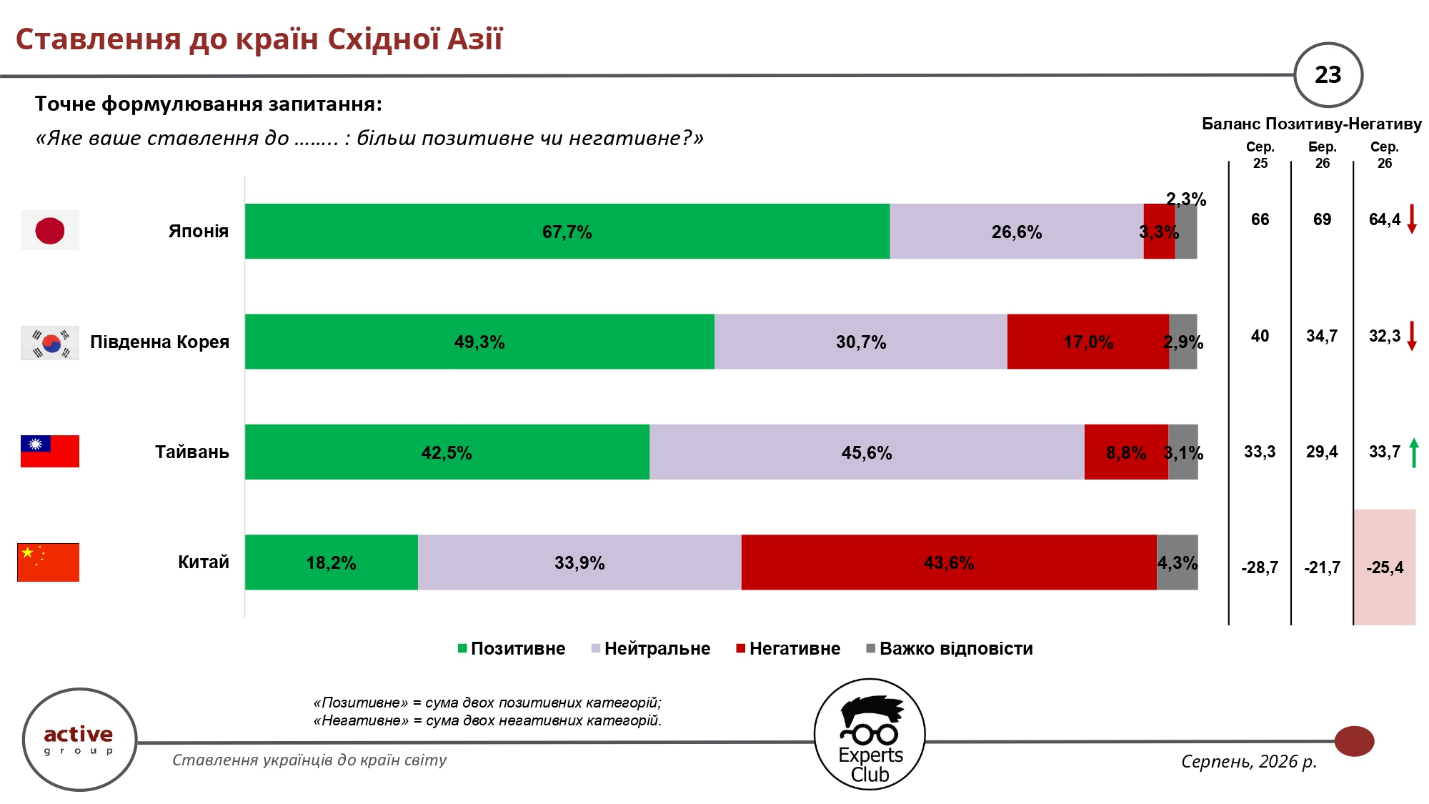
Thailand is viewed positively by 30.9% of respondents, neutrally by 59.5%, negatively by 3.9%, and 5.7% were undecided. The balance of positive and negative assessments stands at 27 percentage points, compared to 25 percentage points in March 2026.
Vietnam is viewed positively by 21.5% of respondents, neutrally by 60.5%, and negatively by 12.1%. The balance stands at 9.4 percentage points and has gradually increased over the three waves of the survey: from 6.7 percentage points in August 2025 to 8.8 percentage points in March and 9.4 percentage points in August 2026.
Regarding Indonesia, 20.9% of Ukrainians expressed a positive attitude, 66.3% chose a neutral response, 6.1% expressed a negative attitude, and another 6.7% were undecided. The balance calculated from these percentages is 14.8 percentage points; on the slide, it is shown as 14.2 percentage points, which may be due to rounding or a technical discrepancy in the presentation.
Malaysia has the highest share of neutral assessments in the group—68.9%. 18.6% of respondents view it positively, 4.1% negatively, and another 8.4% were unable to answer. Overall, the published results confirm that public opinion regarding Thailand, Vietnam, Indonesia, and Malaysia is predominantly neutral rather than negative.
India stands out noticeably from the other countries in this group. 17.2% of respondents view it positively, while 31.5% view it negatively and 48.3% view it neutrally. As a result, the balance stands at minus 14.3 percentage points, compared to minus 5.6 percentage points in March 2026 and minus 10.3 percentage points in August 2025. Based on the overall results of the entire study, India has the second-lowest balance after China.
Maksym Urakin, founder of Experts Club, deputy director of the Interfax-Ukraine news agency, and candidate of economic sciences, emphasized the need to analyze Ukrainians’ attitudes toward other countries alongside actual economic ties.
“In other words, the deficit has increased by more than $10 billion over the past year. Therefore, it is very important for us to analyze our main partners,” Urakin noted. In his opinion, sociological data can complement trade analysis and help better understand promising areas of international cooperation.
Oleksandr Pozniy, Director of the research company Active Group, drew attention to the importance of the economic and informational components of bilateral relations.
“We need to do more than just raise general awareness. First and foremost, business associations, the Ministry of Economy, and the Ministry of Foreign Affairs must work to develop bilateral relations and improve the balance,” Pozniy noted. He also advocated for expanding cooperation with markets where Ukraine has opportunities to increase exports.
Overall, the results show a significant difference in perceptions of individual Asian countries. While neutrality prevails regarding Thailand, Vietnam, Indonesia, and Malaysia—with positive assessments outnumbering negative ones—perceptions of India lean toward the negative.
The survey was conducted in August 2026 using self-administered online questionnaires in the SunFlowerSociology panel among 800 Ukrainian citizens aged 18 and older. The sample is representative by age, gender, and region; the stated maximum theoretical statistical margin of error is ±3.5 percentage points. This is the third wave of the study, following surveys conducted in August 2025 and March 2026.
ACTIVE GROUP, EXPERTS CLUB, INDIA, INDONESIA, MALAYSIA, SOCIOLOGY, SOUTH ASIA, Southeast Asia, THAILAND, UKRAINE, VIETNAM
According to Experts Club, Italy and Spain have the highest levels of positive attitudes among Ukrainians among the Southern European countries included in the study—70.1% and 65.2%, respectively. At the same time, a significant portion of respondents hold a neutral stance toward Greece and Slovenia, while attitudes toward Serbia remain the most mixed. This is evidenced by the results of the third wave of the study “Ukrainians’ Attitudes Toward Countries Around the World,” conducted by Active Group in collaboration with Experts Club, reports the Experts Club Information and Analytical Center.
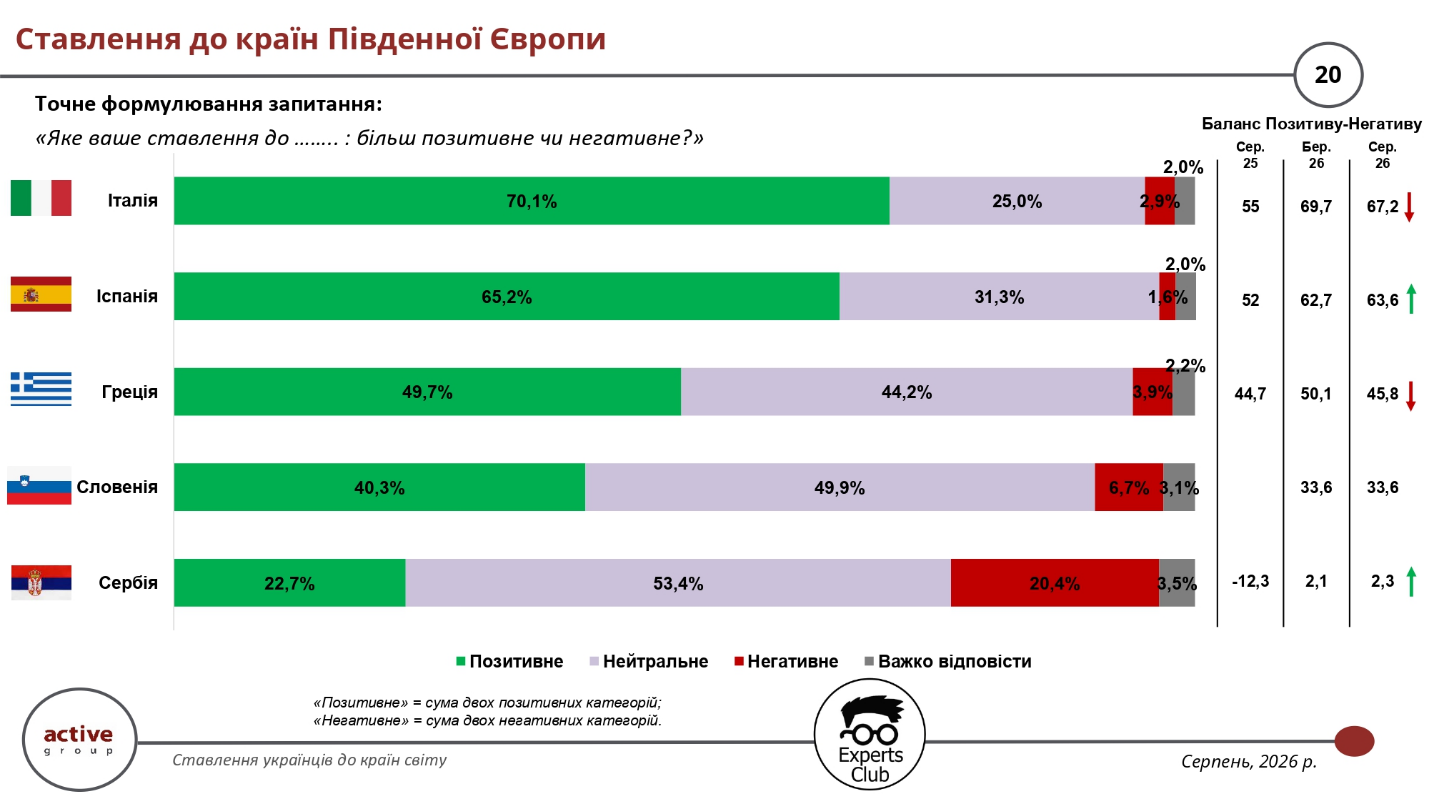
Italy has the best result in the regional group: 70.1% of respondents view it positively, 25% neutrally, 2.9% negatively, and another 2% were undecided. The balance of positive and negative assessments stands at 67.2 percentage points. In March 2026, it was slightly higher—69.7 percentage points—but compared to August 2025, when the figure stood at 55 percentage points, attitudes remain significantly more favorable.
Spain is viewed positively by 65.2% of respondents, neutrally by 31.3%, and negatively by only 1.6%. The balance stands at 63.6 percentage points, compared to 62.7 percentage points in March and 52 percentage points in August of last year. Thus, among the Southern European countries surveyed, Spain is the one showing consistent growth in the balance compared to previous waves.
49.7% of Ukrainians view Greece positively, 44.2% neutrally, and 3.9% negatively. The balance of positive and negative assessments stands at 45.8 percentage points, compared to 50.1 percentage points in March 2026 and 44.7 percentage points in August 2025. This indicates a relatively stable perception of the country, with positive and neutral assessments predominating.
Regarding Slovenia, 40.3% of respondents expressed a positive attitude, while nearly half—49.9%—took a neutral stance. 6.7% view the country negatively, and the balance stands at 33.6 percentage points, the same as in March 2026.
The most contrasting results in the group were recorded for Serbia. 22.7% of Ukrainians view it positively, 20.4% negatively, and the majority, 53.4%, hold a neutral position. The balance stands at plus 2.3 percentage points. At the same time, the trend has improved compared to August 2025, when the indicator was negative—minus 12.3 percentage points.
Maksym Urakin, founder of Experts Club, deputy director of the Interfax-Ukraine news agency, and candidate of economic sciences, emphasized the need for foreign partners to communicate more actively with Ukrainian society.
“The first recommendation is to regularly showcase concrete achievements and specific actions. The second is to be open to questions and inquiries from the media and the public,” Urakin noted.
According to him, sociological data can help diplomatic missions and businesses assess public perception and build bilateral relations more effectively.
Oleksandr Pozniy, director of the research firm Active Group, highlighted the need to combine public awareness with the development of practical economic cooperation.
“We need to do more than just raise general awareness. First and foremost, business associations, the Ministry of Economy, and the Ministry of Foreign Affairs need to take action,” Pozniy noted.
According to him, the most promising areas are those where Ukraine can deepen bilateral ties and increase exports.
In a broader context, the study shows that Ukrainians’ attitudes toward most Southern European countries remain positive or neutral. Italy and Spain score particularly high, while public opinions regarding Serbia are significantly more polarized, although the balance has improved over the past year.
The survey was conducted in August 2026 using self-administered online questionnaires in the SunFlowerSociology panel among 800 Ukrainian citizens aged 18 and older. The sample is representative by age, gender, and region, and the stated maximum theoretical margin of error for indicators at the 50% confidence level is ±3.5 percentage points. This is the third wave of the study, following surveys conducted in August 2025 and March 2026.
ACTIVE GROUP, EXPERTS CLUB, GREECE, ITALY, SERBIA, SLOVENIA, SOCIOLOGY, SOUTHERN EUROPE, SPAIN, UKRAINE

According to the Serbian business media outlet Parametar, a serious train accident occurred in Croatia on October 10 on the approach to the Meja station near Rijeka. Freight train No. 82318, operated by Transagent and carrying a grain cargo toward Rijeka, derailed.
According to official data from HŽ Infrastruktura, the accident occurred around 9:25 a.m. on the incoming track at Meja Station. Eleven cars derailed and ended up in a deep ravine. The locomotive and two other cars remained at the station. There were no injuries, but significant property damage was caused to the railway infrastructure, and the Plase–Meja section is closed to traffic.
The Croatian Agency for the Investigation of Incidents in Air, Maritime, and Rail Transport (AIN) has launched an investigation into the circumstances of the accident. The agency confirmed that a report of a serious incident was received on October 10 at approximately 9:25 a.m. and concerned the derailment of several cars of train No. 82318 on line M202.
According to the Croatian publication Novi list, 11 cars were loaded with grain, presumably of Ukrainian origin. However, an official statement from HŽ Infrastruktura confirms only the transport of grain and does not specify the country of origin of the cargo.
A preliminary theory under consideration is that the locomotive’s brakes failed.
The train belonged to the carrier Transagent Rail, part of the Transagent logistics group based in Rijeka. The company specializes in rail and multimodal freight transportation in Central and Southeastern Europe.
The investigation into this accident is ongoing. The exact causes of the derailment are to be determined by AIN experts.
Source: HŽ Infrastruktura, Croatian Agency for the Investigation of Accidents in Air, Maritime, and Rail Transport (AIN), Novi list.
Canada has the highest balance of positive and negative attitudes among Ukrainians—not only among the countries represented in the Americas and Australia, but also among all countries covered by the study: in August 2026, it stood at 73.8 percentage points. Australia scored 61.6 percentage points, the U.S. — 38.4 percentage points, and Brazil — 19.4 percentage points. These findings are based on the results of the third wave of the study “Ukrainians’ Attitudes Toward Countries Around the World,” conducted by Active Group in collaboration with Experts Club, according to the Experts Club Information and Analytical Center.
Canada is viewed positively by 76.3% of Ukrainians surveyed, negatively by only 2.5%, neutrally by 19.2%, and another 2% were undecided. As a result, the balance of positive and negative assessments stands at 73.8 percentage points—the highest value among Ukraine’s 50 largest trading partners included in the study.
Australia ranks second in this regional group: 63.8% of respondents expressed a positive attitude toward it, 32.1% were neutral, only 2.2% were negative, and another 2% were undecided. The balance of positive and negative assessments stands at 61.6 percentage points, which also indicates a predominantly positive perception of the country among the Ukrainian audience.
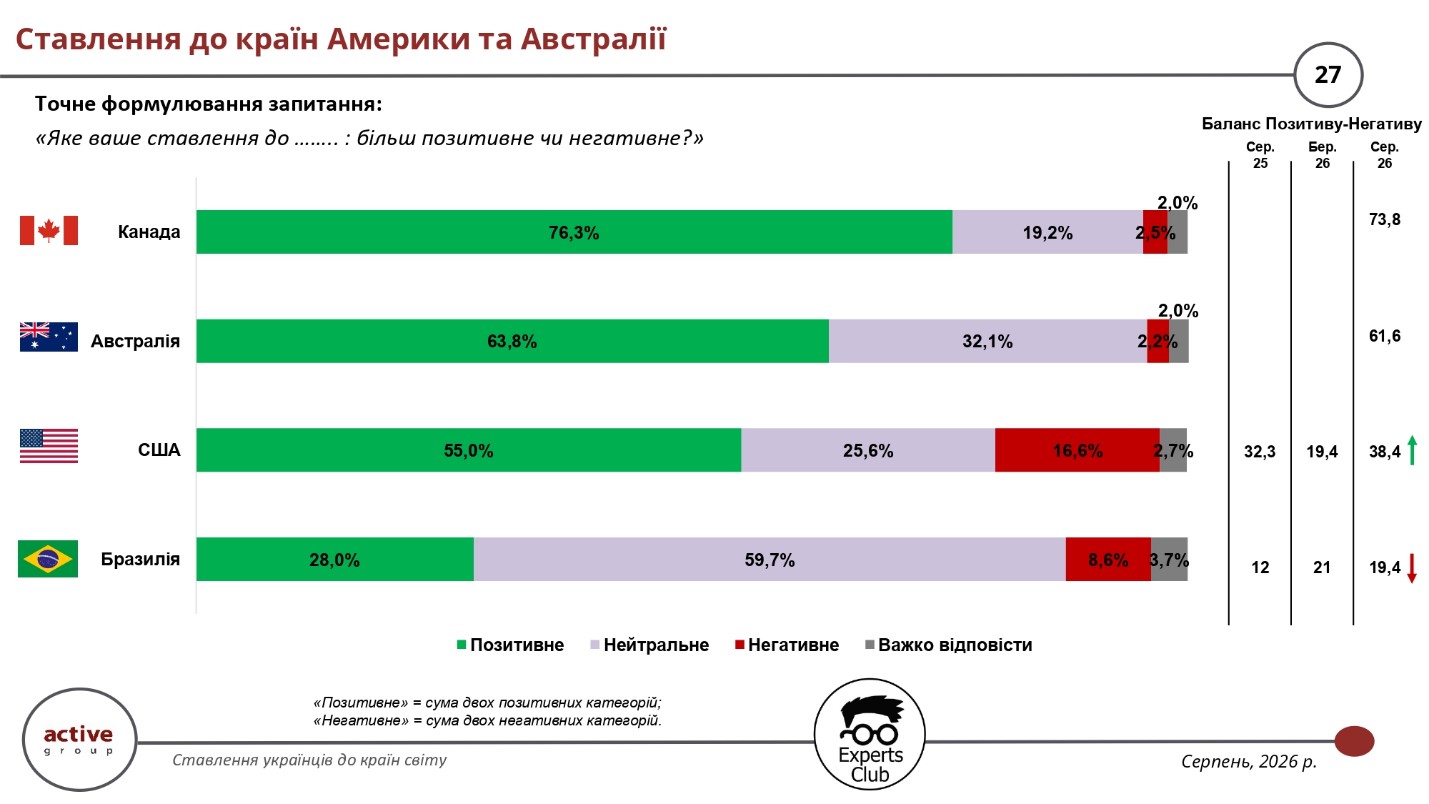
Fifty-five percent of respondents view the U.S. positively, 16.6% negatively, 25.6% neutrally, and another 2.7% were unable to answer. The balance stands at 38.4 percentage points. At the same time, this figure has improved significantly compared to the previous survey wave: in March 2026, the figure was 19.4 percentage points, while in August 2025, it was 32.3 percentage points. Thus, over the course of five months, the balance of attitudes toward the U.S. has increased by 19 percentage points.
Brazil is viewed much more neutrally. Twenty-eight percent of Ukrainians expressed a positive attitude, while 59.7% chose a neutral response, 8.6% expressed a negative attitude, and another 3.7% were undecided. The balance of positive and negative assessments stands at 19.4 percentage points, compared to 21 percentage points in March 2026 and 12 percentage points in August 2025.
Thus, the data reveal significant differences within the group: Canada and Australia are characterized by a high level of established positive attitudes; in the U.S., positive assessments also predominate and have increased noticeably compared to March, while a neutral stance dominates regarding Brazil. Overall, Canada tops the entire ranking of the surveyed countries with a balance of +73.8 percentage points
Maksym Urakin, founder of the Experts Club Information and Analytical Center, deputy director of the Interfax-Ukraine news agency, and candidate of economic sciences, emphasized the need for systematic communication between foreign countries and Ukrainian society.
The survey was conducted in August 2026 using self-administered online questionnaires in the SunFlowerSociology panel among 800 Ukrainian citizens aged 18 and older. According to the organizers, the sample is representative in terms of age, gender, and region; the maximum theoretical statistical margin of error for indicators at the 50% confidence level is ±3.5 percentage points. This is the third wave of the study, following surveys conducted in August 2025 and March 2026.
ACTIVE GROUP, AMERICA, AUSTRALIA, BRAZIL, CANADA, EXPERTS CLUB, PUBLIC OPINION, SOCIOLOGY, the U.S., UKRAINE, URAKIN



