

In September 2026, 1,457 new trucks and specialty vehicles were added to Ukraine’s fleet, which is 31% more than in September of last year, according to a report by “Ukravtoprom” on its Telegram channel.
Compared to August of this year, demand for these vehicles increased by 39%.
“This is a record monthly result for this market segment since January 2022,” the association noted.
Renault remains the market leader with 422 units, a 69% increase from a month ago.
Fiat took second place, increasing sales by 76% compared to August 2026—to 118 units—while Mercedes-Benz came in third, with 114 registrations compared to 121 in August.
Next were Hyundai with 93 units and Volkswagen with 90 units (neither was among the top five in August).
As previously reported, in September of last year, the top five were Renault, Ford, Citroën, MAN, and Scania, with sales rising by 6% compared to September 2024—to 1,068 units.
According to data from “Ukravtoprom,” over the first nine months of 2026, the growth rate of sales of trucks and specialty vehicles accelerated to 17% compared to the same period last year, reaching 10,083 thousand new vehicles (for January–August, the sales growth rate was 14%).
As reported, citing data from “Ukravtoprom,” registrations of new trucks and specialty vehicles in 2025 fell by 5% compared to 2024—to nearly 12,300 vehicles.
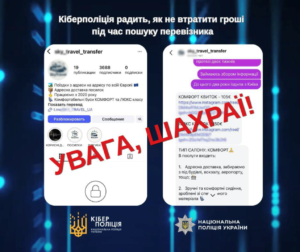
Scammers in Ukraine use ads for passenger and freight transportation to obtain advance payments by creating fake pages for private carriers and logistics companies.
To build trust, the scammers use photos of real buses and trucks, logos of well-known companies, reviews from other people, and other copied materials. Potential customers are usually lured in by lower travel or delivery costs compared to market rates.
Once a customer contacts them, the scammers try to get the money as quickly as possible. In particular, they may claim that there are almost no seats left or that an advance payment must be made immediately to confirm the reservation.
When arranging freight transportation, scammers may demand full payment in advance via a credit card or to an individual’s bank account. After receiving the money, the fake carrier stops responding, and the ad or page is deleted. In some cases, after the first transfer, the customer is asked to make additional payments supposedly for insurance, documents, customs clearance, or other services.
Experts cite the following as signs of potential fraud: a significantly low price, a demand for an urgent prepayment, communication exclusively via messaging apps, recently created carrier pages, and a lack of operational history. The risk also increases if the carrier refuses to provide detailed information about the route, vehicle, and terms of transport, or demands new payments after an agreement has been reached.
Links for booking and payment pose a particular danger. They may lead to phishing sites that mimic the appearance of banking and payment services. Their purpose is to obtain bank card details and other payment information.
Users are advised to verify the company name and phone number through several independent sources before making a payment, review the carrier’s reviews and track record, and avoid sharing CVV codes, passwords, or one-time transaction confirmation codes.
If money has already been transferred to scammers, it is recommended to save the correspondence, screenshots of the ad, and payment confirmation. If you have disclosed your banking information, you should contact your bank as soon as possible. You can also report cases of fraud to the Cyber Police or by calling 102 or 112.
You can learn more about current fraud schemes and ways to protect yourself on the StopFraud platform.

Nataliia Haidt has been appointed Executive Director of the Association “Union of Dairy Enterprises of Ukraine” (UDEU) effective October 2, 2026, the association’s press service reported.
Haidt has two higher education degrees — in economics and law — as well as experience in managerial positions at state-owned enterprises and commercial organizations. Since 2021, she has cooperated with UDEU as an expert and project manager.
Among her main tasks in the new position, Haidt named representing the interests of the dairy business before the government, the Verkhovna Rada and international partners, as well as adapting the industry to the requirements of the European Union.
“Ukraine’s dairy industry operates amid war, energy instability, a shortage of personnel, a logistics crisis and other challenges. At the same time, we face the task of harmonization with the requirements of the European Union. Each of these crises is a challenge for the entire chain: from farm to shelf,” Haidt noted.
According to her, UDEU will continue to promptly communicate the position of industry enterprises to the authorities and international partners and propose practical solutions to the problems of the dairy sector.
“The strength of the dairy business in this difficult time lies in unity and cohesion,” the new Executive Director emphasized.
The previous Executive Director of UDEU, Arsen Didur, completed his work in the position on September 30, 2026.
The Association “Union of Dairy Enterprises of Ukraine” represents the interests of dairy industry enterprises and participates in interaction between business and state authorities on the regulation and development of the dairy sector.

Using artificial intelligence to manage building systems can reduce their overall energy consumption by 22% compared to traditional control systems, according to the results of a new study by Schneider Electric.
The company presented the study, “AI for Climate: Quantifying the Energy and Carbon Impact of Building Optimization,” on September 21 as part of Climate Week NYC 2026. Its findings show that artificial intelligence can use existing data on building operations to automatically manage energy consumption and reduce operating costs.
In particular, using artificial intelligence to optimize heating, ventilation, and air conditioning (HVAC) systems through an intelligent building management system delivers additional energy savings ranging from 7.2% to 12.7%.
In some simulated scenarios, total energy savings exceeded 200 MWh per year per building, and emissions reductions reached nearly 60 metric tons of CO₂ equivalent. According to Schneider Electric’s calculations, the volume of emissions avoided was more than 100 times greater than the carbon footprint of the AI system itself.
Based on current commercial rates in the markets used in the study, the potential cost savings ranged from $13,600 to $49,300 per year per building. The specific financial impact depends on the country, energy costs, building type, climatic conditions, and the existing management system.
The study was conducted using building energy modeling, with the results validated through real-world pilot projects. The analysis covered various operational scenarios for facilities in the United States, Australia, and India.
Artificial intelligence analyzes several types of information simultaneously—actual occupancy levels, weather forecasts, equipment status and performance, and other operational metrics. Based on this data, algorithms can adjust the operation of heating, ventilation, and air conditioning systems in real time.
“The future of building management will be determined by how effectively organizations can integrate and utilize data that was previously stored in siloed systems. The level of artificial intelligence integrated into existing business systems is capable of transforming complexity into intelligence, and intelligence into action, while simultaneously reducing emissions, cutting costs, and increasing efficiency,” said Pankaj Sharma, Executive Vice President of Software and Services at Schneider Electric.
A key finding of the study was the potential effectiveness of AI not only for large commercial complexes. Schneider Electric notes that buildings with an area of less than 100,000 square feet—or about 9,300 square meters—can also benefit significantly.
Previously, the implementation of complex energy management systems in relatively small facilities was often limited by cost and the need to maintain specialized staff. The use of AI allows for the automation of certain processes and makes intelligent energy management accessible to a wider range of facilities.
For Ukraine, improving the energy efficiency of buildings is particularly important due to damage to the energy infrastructure and the need to simultaneously rebuild the residential, commercial, and public building stock.
“For Ukraine, the issue of energy efficiency today is no longer just a matter of electricity costs or decarbonization. It is a matter of sustainable development. Every kilowatt-hour that a building can avoid consuming without compromising conditions for its occupants reduces the load on the energy system. Artificial intelligence makes it possible to move from simply tracking consumption to actively managing it—taking into account building occupancy, weather, and equipment operating modes to automatically select the most efficient scenario,” said Mykhailo Bubnov, CEO of Schneider Electric Ukraine.
According to him, this approach may be particularly promising for facilities with high and relatively complex energy consumption.
“In Ukraine, we see great potential in hospitals, universities, administrative and office buildings, shopping centers, hotels, and industrial facilities. But even more important is the ability to immediately implement modern management systems during renovations and new construction. If we incorporate digital infrastructure and energy efficiency right from the design stage, we can create buildings that consume less energy from the outset and are better able to adapt to changes in load and operating conditions,” emphasized Bubnov.
According to Schneider Electric Ukraine, the widespread adoption of smart building management systems has the potential to benefit more than just individual property owners. Reducing and more flexibly managing energy consumption across a large number of facilities can alleviate the strain on the power grid during periods of peak demand.
However, the results of international studies cannot be automatically applied to every Ukrainian facility. The actual savings potential depends on the condition of the building, its engineering systems, operating mode, climatic conditions, and the degree of automation.
The company notes that when restoring damaged facilities, it is advisable to implement digital management systems as early as the design phase. In this case, energy efficiency becomes an integral part of the building’s engineering infrastructure from the moment it is commissioned, rather than a separate, subsequent modernization.
Schneider Electric operates in the fields of energy technologies, electrification, automation, and digitalization of buildings, industry, data centers, infrastructure, and power grids. The company operates in over 100 countries worldwide.
artificial intelligence, BUILDING, ENERGY EFFICIENCY, Schneider Electric, UKRAINE, Бубнов

A one-time check of a counterparty before concluding a contract does not make it possible to fully control commercial risks: a company’s financial condition, its owners, management and payment discipline may change already in the course of cooperation. Therefore, Ukrainian businesses should move from one-time checks to continuous monitoring of key partners.
International business information systems, including Dun & Bradstreet (D&B), make it possible not only to obtain information about a company before starting cooperation, but also to track changes in its profile.
According to Maksym Urakin, Director of Development and Marketing at Interfax-Ukraine and head of the D&B-Interfax-Ukraine business unit, monitoring is particularly important for companies to which a Ukrainian supplier regularly provides deferred payment terms or with which a significant volume of turnover is associated.
“A counterparty may have looked absolutely reliable at the time the contract was signed, but six months later the situation may be different. The company’s debt burden may increase, its owner or management may change, or its payment discipline may deteriorate. If the supplier learns about this only after an overdue payment, managing the risk becomes significantly more difficult,” Urakin noted.
International D&B databases are used to track changes in corporate data and assess business risks. Depending on the information available for a particular jurisdiction, a user can analyze changes in an enterprise’s financial condition, its corporate structure and other characteristics.
This approach is particularly relevant for companies with a large number of customers and suppliers. With hundreds or thousands of counterparties, regularly checking each of them manually is practically impossible.
“Businesses need to identify critically important partners. The greater a counterparty’s debt to the company, or the more strongly the supply chain depends on it, the higher the frequency and depth of monitoring should be,” Urakin believes.
A change in risk indicators does not necessarily require the immediate termination of cooperation. It may serve as a signal to revise the credit limit, shorten the payment deferral period, request additional collateral or conduct a more in-depth check.
A separate area is supplier monitoring. Financial problems at a raw-material producer, carrier or another critically important partner can lead to a halt in supplies even when the Ukrainian company’s own financial position remains stable.
According to Experts Club, Ukrainian enterprises should divide counterparties at least according to their level of financial significance and the potential damage from default or termination of supplies, while the most critical partners should be monitored continuously.
“In a modern risk management system, the question should be not only ‘whom did we check before concluding the contract,’ but also ‘what has changed with our largest counterparties since the check.’ It is monitoring that makes it possible to identify a problem before it turns into a direct financial loss,” Urakin emphasized.
Dun & Bradstreet is an international provider of business data and analytical solutions whose history began in 1841. The company provides tools for business identification, counterparty checks, assessment of credit and commercial risks, compliance, supply chain management and work with corporate data.
The official representative of Dun & Bradstreet in Ukraine is the Interfax-Ukraine news agency. The specialized D&B-Interfax-Ukraine unit helps Ukrainian companies work with international business data, check foreign partners and obtain a D-U-N-S Number.

Ukrainian President Volodymyr Zelenskyy held a conversation with Polish Prime Minister Donald Tusk.
“I informed the prime minister about preparations for possible trilateral meetings at the technical level between Ukraine, the United States, and Russia. There are no obstacles on our part, but it is important that the American side prepare on its end and ensure the Russian side’s readiness,” Zelenskyy wrote on his Telegram channel.
The parties also discussed preparations for the Ukrainian power grid ahead of winter and other sensitive issues.
“Not everything can be discussed in detail over the phone—we agreed to meet in person in the near future. I am grateful to Donald and Poland for their support. Only by joining forces across Europe can we stop Russia and prevent this insane war from continuing,” the president concluded.



