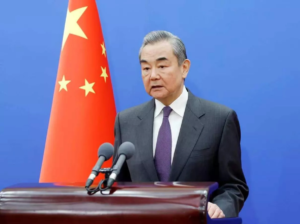
Information that China’s Foreign Minister Wang Yi said Ukraine is viewed as a “friend and partner” is confirmed by China’s official statements. The remark was made on February 15, 2025, during Wang Yi’s meeting with Ukraine’s Foreign Minister Andrii Sybiha on the sidelines of the Munich Security Conference, Xinhua reported.
According to Xinhua’s publication, Wang Yi noted that China and Ukraine maintain a “traditional friendship,” and that bilateral relations are based on the strategic partnership established in 2011. He also said Beijing is ready to work with Kyiv to advance bilateral relations and practical cooperation despite “unfavorable factors.”
In 2026, the topic of China–Ukraine contacts was again brought to the fore at this year’s Munich conference. Ukraine’s Foreign Minister Andrii Sybiha said on February 13, 2026, that he invited Wang Yi to visit Ukraine and stated that China could help achieve an end to the war.
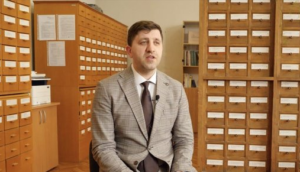
More than 20 million digitized documents have already been collected in the state “online archive” system, where users can search for materials by keywords, Head of the State Archival Service of Ukraine Anatolii Khromov said in an exclusive interview for the Culture desk of Interfax-Ukraine news agency.
“It was presented in 2022, and now the system already contains more than 20 million digitized documents, which can be searched by keywords,” Khromov said.
According to him, the digitization of the archival system has several levels. The first is basic access in reading rooms, where visitors can work with materials and take photos of documents on their own phone. The second is professional digitization using specialized scanners and software, which requires significant resources and is financed through partnership agreements and a special archives fund.
Khromov also noted that today virtually all state archives have their own websites, and the system operates inter-archive search portals that enable users to find information remotely.
Separately, he emphasized the transition of archives to a service-based access model: basic options for users remain free of charge, while additional services are paid due to the need for resources.
“People can work in reading rooms free of charge, view materials online, and make their own digital copies. But if someone needs a professional scan copy, official certification, or special document processing, this is already a separate procedure that requires resources,” the Head of the State Archival Service explained.
He clarified that the free options include, in particular, work in the reading room and self-copying, but for this a person needs to physically come to the archive. At the same time, remote copying, he said, may cost approximately about UAH 5 per page, which for many is more convenient and cheaper than travel expenses.
According to Khromov, digital tools and expanded online access are also important for security during wartime: digital copies allow reducing the physical use of originals and keeping them in storage facilities, minimizing the risks of damage to documents.
Source — Interfax-Ukraine

February 13, 2026, 11:00
Kyiv City State Administration (KCSA), Column Hall
(Kyiv, 26 Khreshchatyk St.)
Competition organizers:
The National Industry Partnership in Ukraine’s Light Industry “Fashion Globus Ukraine” and the Italian association VITAWORLD
On February 13, 2026, the Column Hall of the Kyiv City State Administration will host the ceremonial final of the 8th All-Ukrainian Professional Skills Competition “Fashion PRORYV for Freedom and Peace” https://fashionglobusukraine.com/konkurs/ua/fashion-proryv-2026 — a large-scale event that brings together fashion, education, culture, and international partnership between Ukraine and Italy. The final in Kyiv will take place in the format of a runway show featuring collections of sportswear and adaptive clothing, as well as an awards ceremony for the winners.
The Fashion PRORYV competition, launched in 2016, has become a unique platform for cooperation among educators, manufacturers, young designers, and sewing professionals. The project, initiated by Fashion Globus Ukraine, has created an effective model of interaction between education, business, and creativity.
“Over the years of the war with the Russian Federation, we have created a platform of peacebuilding cultural diplomacy, where Ukraine speaks to the world not in the language of pity, but in the language of dignity, creativity, and culture. We have created a precedent: when a competition in the fashion industry became a narrative about humanity, strength, resilience, and hope,” says the competition’s President, Golda Vynohradska.
Over the years, the competition has been held under the patronage of the city halls of Lviv, Kharkiv, Khmelnytskyi, and Kryvyi Rih. In 2025, the project received support from the U.S. Embassy in Ukraine, and in 2026—from the City of Milan.
Fashion as cultural diplomacy
During wartime, Fashion PRORYV has taken on special significance, turning into a platform for cultural diplomacy and international dialogue. Each year, between 60 and 100 educational institutions from all regions of Ukraine take part in the competition. In 2025, the winners’ collections were presented in Paris, Oslo, Milan, and Luxembourg.
This year’s competition is dedicated to cooperation with Italy and the theme of sports. It features students from 52 Ukrainian fashion-industry educational institutions and 4 Italian universities (Venice, Salerno, Milan, Rome).
International finals in Kyiv and Milan
A ceremonial international presentation will take place on February 28, 2026, in Milan (Milan San Siro Hotel) as part of the Milano-Cortina 2026 events and Milan Fashion Week.
Such projects demonstrate Ukraine’s innovative potential, young people’s prospects, and the value of human capital.
Distinguished guests and professional jury
The event will be attended by:
• representatives of the diplomatic corps,
• Olympic champions,
• cultural and sports figures,
• leaders of the fashion industry of Ukraine and Italy.
The jury includes leading experts in fashion, education, and creative industries of Ukraine and Italy: Ivan Frolov, Katya Silchenko, Olena Holets, Taras Prytula, Kateryna Myroshnychenko, Halyna Yerko, Emilia Ametrano, Walter Togni, Elena Kalencani.
General partner of the competition: SOFTORG
Invitation
The organizers invite journalists and media representatives to share in the celebration of Fashion PRORYV—an event about courage, talent, and the power to create the future even in the most difficult times. Such projects demonstrate Ukraine’s breakthrough, prospects for youth, and above all the value of human capital!
Media accreditation
For accreditation and additional information:
+38 067 220 86 37
Goldafashion.ua@gmail.com
www.fashionglobusukraine.com
Interfax Ukraine is the official information partner of the event.
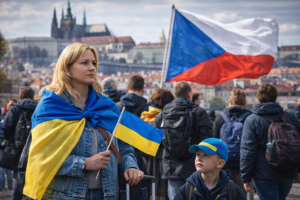
As of December 31, 2025, 1,131,197 foreigners were registered in the Czech Republic – 37,108 more than the previous year (+3.4%), according to data from the Ministry of the Interior and the statistical unit of the Czech Statistical Office, as cited by the information and analytical center Experts Club.
According to the Ministry of the Interior’s estimate, foreigners account for 10.38% of the country’s population (the calculation used a population figure of 10,897,178 as of September 30, 2025). This means that the “native population” (residents without foreign citizenship) amounts to about 9.766 million people (an estimate based on the difference between the figures).
The structure of legal residence at the end of 2025 included 343,876 people with temporary residence, 394,265 with permanent residence, and 393,056 registered under the temporary protection regime. The highest concentration of foreigners is recorded in Prague (32.4% of all registered foreigners) and in the Central Bohemian Region (14.5%).
Ranking: Top 10 nationalities among foreigners in the Czech Republic (31.12.2025)
| Rank | Country | Number of people |
|---|---|---|
| 1 | Ukraine | 612,953 |
| 2 | Slovakia | 125,280 |
| 3 | Vietnam | 69,685 |
| 4 | Russia | 37,524 |
| 5 | Romania | 21,287 |
| 6 | Poland | 17,631 |
| 7 | Bulgaria | 17,562 |
| 8 | Mongolia | 14,908 |
| 9 | Philippines | 14,530 |
| 10 | Hungary | 12,111 |
On February 10, 2026, Transparency International published the Corruption Perceptions Index (CPI) 2025—an annual ranking of perceptions of corruption in the public sector. In the new release, Ukraine received 36 points out of 100 and ranked 104th out of 182 countries and territories.
Ukraine’s score increased by 1 point compared to the previous edition of the index. In CPI 2024, Ukraine had 35 points and ranked 105th (that edition assessed 180 countries and territories).

The TI report notes that Ukraine belongs to the group of countries that are gradually “moving from the bottom of the ranking toward the middle” thanks to long-term efforts to build an anti-corruption infrastructure. At the same time, the document describes 2025 as difficult for Ukraine—against the backdrop of high-profile scandals in procurement and the defense sector, but with an important emphasis: the exposure of violations and bringing cases to verdicts indicates that the new anti-corruption architecture “is delivering results.”
Overall, CPI 2025 records a further deterioration of the global picture: the world average score fell to 42 points, and more than two thirds of countries scored below 50 points. Denmark once again received the highest score (89), and at the bottom of the list are Somalia and South Sudan (9 each).
The CPI measures not “actual corruption,” but perceptions of the level of corruption in the public sector, aggregating data from expert assessments and business surveys on a 0–100 scale.

The current stage of economic development is characterized by the diffusion of innovations and the rapid development of systems for the protection and safeguarding of intellectual property (IP). A number of countries, such as China, Japan, and Korea, have become leading countries of the world because IP has become the main driving force of development. The development of IP in these countries occurred due to state decisions on the development of education and science and support for scientific research.
In Ukraine, the situation is different. Over the last 30 years, there has been a clear and systematic deindustrialization of the country, a decrease in funding for science, and an orientation of science not toward results, but toward “Scopus” publications, which leads to a decline in patent activity and the quality of patent proposals. Table 1 presents the dynamics of the receipt of applications for inventions and utility models during 2004–2023.
The analysis of inventive activity was carried out for the period from 2004, when the Civil Code of Ukraine entered into force, which annulled declarative patents without conducting a qualification examination, “short patents,” and expanded the list of utility models, which makes it impossible to compare inventive activity before and after 2004.
Having analyzed changes in patenting trends, one can see that starting from 2004 applicants, in order to minimize the costs of obtaining a patent, intensified the filing of applications for utility models, which reduced the number of applications for inventions and negatively affected the technical level of patents, since the registration of utility models is carried out without conducting a substantive examination. In 2008, their share in the total number of filed applications already reached 77% compared to 56% in 2004, with a decrease in the share of applications for inventions—from 44% to 23%.
The 2008–2009 crisis led to a slight decline in inventive activity in Ukraine. Starting from 2014, a negative trend was observed in the filing of applications for inventions and utility models, associated with the events of 2014.
A significant drop in inventive activity in 2020 is caused by a number of objective reasons. By Resolution of the Cabinet of Ministers of Ukraine dated 12.06.2019 No. 496, the amounts of fees for filing applications and other actions necessary to obtain protection documents were significantly increased. The entry into force of the Law of Ukraine dated 21.07.2020 No. 816 “On Amendments to Certain Legislative Acts of Ukraine Regarding the Reform of Patent Legislation,” which limited the list of objects protected as utility models, led to a sharp drop in the number of applications for utility models (by almost 38%). The COVID-19 pandemic also made its adjustments.
The highest rates of decline were observed in 2022 as a result of Russian military aggression. The number of applications for inventions decreased by almost 19%, and for utility models—almost by half compared to the previous year. And the number of international PCT patents of Ukraine in general has never over the last 30 years reached 200 per year, which corresponds to the patent activity of the 5th–6th university in the world. That is, inventors of Ukraine practically do not see prospects for commercialization of their ideas abroad or do not have funds for such patenting, which costs 5–15 thousand US dollars, and prefer national procedures for filing applications.
If we assess the situation as a whole, then in Ukraine over the years of independence it has not been possible to form a reliable system of IP protection. The main gaps in this sphere are quite clearly and balancedly outlined in the draft National Strategy for the Development of the IP Sphere in Ukraine for the period 2020–2025, which was successfully discussed at the parliamentary hearings “Building an Effective IP Protection System in Ukraine” on 16.12.2019. The final conclusion was formulated harshly: “As a result, IP in Ukraine is still not considered as one of the key factors in the economic, social and cultural development of the country.” But despite the successful discussion in parliament, the Strategy was never adopted. Now the Ukrainian National Office for Intellectual Property and Innovations (UANIPIO) has prepared a new draft Strategy, which will be submitted to the Ministry of Economy for further processing. One of the main reasons for the problems of invention is the lack of interest of state authorities in the development of domestic industry, science, and education. This is perfectly demonstrated (Table 2).
The share of expenditures on science in the gross domestic product (GDP), starting from 2010, has steadily decreased and in recent years has decreased to 0.33%, which is almost 15 times less than Israel’s funding of science, and taking into account the extremely low GDP, it is generally unacceptable. Without funding, the development of science is simply impossible.
The structure of capital investments in Ukraine (Table 3) shows an extremely low level of investment in intangible assets (IA) within 3.6–6.7% of the total amount of capital investments. If we take into account that for many years the share of capital investments in GDP up to 2022 did not exceed 15%, then the share of investments in IA does not exceed 0.8–1.0% of GDP, which does not correspond to global trends, according to which the total volume of investments in IA in 2023 reached 6.9 trillion US dollars, amounting to 2.9 trillion in 1995. Since 2008, the growth rate of investments in IA has been three times higher than the growth rate of investments in tangible assets. In 2023, investments in IA amounted to more than 16% of GDP in Sweden, the USA, and France.
Another problem in the development of science is the mismatch of the priorities of Ukraine’s scientific research with global ones, which follows from the analysis of IP. If we look at the state of our patenting, then in short—it is little and not the right thing. Approximately 3–5.5 thousand applications for patents for inventions and utility models are filed per year. Moreover, for 1 invention there are more than 3 utility models, which are absent in the legislation of a number of countries altogether. The world is patented mainly in the 5th technological paradigm (primarily information technologies) and partly in the 6th (nano- and biotechnologies), while Ukraine—in the 3rd (metallurgy, chemistry) and 4th (machine building). This indicates that the state cannot clearly formulate these priorities and make science adhere to them, and also the unwillingness of scientific institutions (SIs) and HEIs, within the framework of autonomy in choosing the directions of scientific research, to change topics. As we researched 50 years ago, so we do now. Numerous changes and reorganizations of state institutions that dealt with Ukraine’s IP also did not contribute to the development of the IP sphere.
The main sources of patenting in Ukraine are HEIs and SIs, whose share of applications in 2023 amounted to about 90%. The share of applications for inventions and utility models from industry decreased from 4.0% in 2019 to 3.0% in 2023. It is clear that this is the result of the destruction of branch and factory science, which always provided the largest number of patents. Unlike Ukraine, the main applicants for patents in the world are corporations and HEIs.
The situation with the sale of IP objects is simply catastrophic. The number of license agreements on the transfer of IP rights as of 01.01.2024, in respect of which information on the transfer of IP rights and the issuance of licenses has been entered into state registers, amounts to 4,085; of these, 87.3% are trademarks and only 3.6% are inventions. In 2022–2024, 251 license agreements for inventions and 240 for utility models were concluded. That is, Ukrainian inventions and utility models are really needed by very few people, which indicates huge problems in the development of Ukrainian science and the practical absence of real results of scientific research that can be commercialized. Thus, contrary to modern trends in the development of international technology transfer, in Ukraine it is practically absent.
It is worth noting that in recent years effective use of startups has been spreading in the world. And despite military actions, a prolonged crisis, and other things, Ukrainians are developing successful startups. From 2020 to 2022, the value of Ukrainian startups increased 3.3 times and reached 23.3 billion euros. By the end of 2023 there were 1,500 active startups in Ukraine.
The Dealroom study, CEE Startups 2025, notes that over the last decade the total value of startups in the region of Central and Eastern Europe (CEE) has increased 15 times, which is more than twice the 7-fold growth in Europe. Private CEE startups have now reached a total value of 163 billion euros. At the same time, Ukraine is in third place with a result of 30 billion euros. Startups that were born in the CEE often relocate: 48% of companies from the CEE moved their headquarters from the country of origin to another. In this unfortunate statistic, Ukraine sets anti-records: more than 90% of startups have moved out of Ukraine, which is explained by unfavorable conditions for their development in Ukraine.
In general, assessing the situation, it can be stated that startups are a new way of commercializing innovations, more flexible and progressive compared to the traditional use of IP. And one can assume that soon startups may replace IP.
Summing up, it can be stated that most of the problems of invention in Ukraine can be solved within a number of years if the laws of Ukraine are steadily implemented, which provide for funding of science in the amount of 1.7% of GDP, and if science is made one of the priorities of the development of the state. And with ensuring funding of science at the level of Israel, it is possible to return leading positions to our science as well.
As US President R. Reagan said: “We fund science not because we are rich. We are rich because we fund science.”
Economics and Forecasting of the National Academy of Sciences of Ukraine”
Table 1. Filing of applications for inventions and utility models in 2004-2023.
| 2004 | 2005 | 2006 | 2007 | 2008 | 2009 | 2010 | 2011 | 2012 | 2013 | 2014 | 2015 | 2016 | 2017 | 2018 | 2019 | 2020 | 2021 | 2022 | 2023 | |
| Vinakhodi,
including |
5778 | 5592 | 5930 | 6163 | 5697 | 4812 | 5310 | 5247 | 4944 | 5418 | 4814 | 4495 | 4092 | 4046 | 3975 | 3856 | 3194 | 3390 | 2758 | 2911 |
| from national applicants | 4090 | 3538 | 3474 | 3440 | 2825 | 2428 | 2554 | 2639 | 2484 | 2858 | 2457 | 2273 | 2231 | 2286 | 2116 | 2103 | 1370 | 1296 | 793 | 1010 |
| Utility models,
including |
5232 | 7286 | 8171 | 8870 | 9600 | 9200 | 10679 | 10437 | 10229 | 10176 | 9384 | 8620 | 9560 | 9118 | 9115 | 8454 | 5273 | 4427 | 2378 | 3504 |
| from national applicants | 5141 | 7156 | 8027 | 8745 | 9450 | 9058 | 10528 | 10285 | 10030 | 9978 | 9244 | 8490 | 9473 | 8979 | 8977 | 8344 | 5059 | 4335 | 2324 | 3427 |
| Total applications | 11010 | 12878 | 14101 | 15033 | 15297 | 14012 | 15989 | 15684 | 15173 | 15594 | 14198 | 13115 | 13652 | 13164 | 13090 | 12310 | 8467 | 7817 | 5136 | 6415 |
Table 2. Dynamics of spending on scientific research and development in 2010-2023.
|
Years |
Expenditures on scientific research and development – total, UAH million/ | Including / % of total R&D expenditures |
Share of research and development spending in GDP, % | |||
| basic scientific research | applied scientific research | scientific and technical (experimental) developments | ||||
| 2010 | 8107,1 | 26,8 | 19,6 | 53,6 | 0,75 | |
| 2011 | 8513,4 | 25,9 | 21,3 | 52,8 | 0,65 | |
| 2012 | 9419,9 | 27,8 | 21,5 | 50,7 | 0,67 | |
| 2013 | 10248,5 | 26,3 | 20,1 | 53,6 | 0,70 | |
| 2014 | 9487,5 | 25,9 | 19,8 | 54,3 | 0,60 | |
| 2015 | 11003,6 | 22,4 | 17,8 | 59,8 | 0,55 | |
|
11530,7 | 19,3 | 22,2 | 58,5 | 0,48 | |
| 2017 | 13379,3 | 21,9 | 23,6 | 54,5 | 0,45 | |
|
16773,7 | 22,4 | 21,3 | 56,3 | 0,47 | |
| 2019 | 17254,6 | 21,7 | 21,1 | 57,2 | 0,43 | |
| 2020 | 17022,4 | 25,0 | 23,3 | 51,7 | 0,41 | |
| 2021 | 20973,8 | 24,6 | 23,0 | 52,4 | 0,38 | |
| 2022 | 17117,8 | 23,8 | 28,2 | 48,0 | 0,33 | |
| 2023 | 21348,1 | 20,7 | 29,7 | 49,6 | 0,33 | |
Table 3. Structure of capital investments in Ukraine by type of assets in 2018-2024.
| 2018 | 2019 | 2020 | 2021 | 2022 | 2023 | 2024 | |
| Total | 100,0 | 100,0 | 100,0 | 100,0 | 100,0 | 100,0 | 100,0 |
| investments in tangible assets | 93,3 | 96,4 | 95,5 | 95,5 | 94,6 | 95,3 | 93,8 |
| residential buildings | 10,1 | 9,5 | 8,7 | 9,1 | 7,9 | 7,1 | 6,9 |
| non-residential buildings | 14,7 | 15,4 | 15,3 | 13,5 | 11,9 | 11,3 | 11,6 |
| engineering structures | 19,4 | 22,6 | 27,0 | 28,0 | 19,8 | 28,1 | 27,2 |
| machinery, equipment and inventory | 33,1 | 34,0 | 31,5 | 30,0 | 32,7 | 32,3 | 32,8 |
| vehicles | 12,1 | 10,8 | 8,9 | 10,3 | 10,6 | 10,2 | 10,1 |
| land | 0,3 | 0,3 | 0,4 | 0,4 | 0,3 | 0,4 | 0,6 |
| long-term biological assets of crop and livestock production | 0,7 | 0,7 | 0,9 | 0,9 | 1,6 | 1,3 | 0,7 |
| other tangible assets | 2,9 | 3,1 | 2,8 | 3,3 | 9,8 | 4,6 | 3,9 |
| investments in intangible assets | 6,7 | 3,6 | 4,5 | 4,5 | 5,4 | 4,7 | 6,2 |
| of them | |||||||
| software and databases | 2,0 | 1,7 | 2,5 | 2,6 | 3,9 | 3,5 | 3,7 |