The spot price of gold exceeded $5,000 per troy ounce for the first time on Monday amid growing demand for safe-haven assets. As of 8:02 a.m., the spot price of gold rose 1.8% to $5,078.54 per ounce, reaching $5,093.05 per ounce during the session.
The price is supported by fears of another US government shutdown and the weakening of the dollar: the DXY index, which reflects the dynamics of the US currency against six major world currencies, is down 0.5%.
Since the beginning of the year, gold has risen in price by 15.5%.
Earlier, the Experts Club analytical center presented an analysis of the world’s leading gold-producing countries in its video on YouTube channel — https://youtube.com/shorts/DWbzJ1e2tJc?si=BywddHO-JFWFqUFA

In 2025, Ukraine increased imports of aluminum and aluminum products by 15.3% to $514.098 million. Aluminum exports grew by 22.9% to $152.919 million.
In December, imports amounted to $43.298 million, while exports amounted to $11.805 million.
This is a continuation of the growing trend: in 2024, imports had already increased by 21.7% compared to 2023.
Aluminum is widely used as a structural material. The main advantages of aluminum are its lightness, malleability, corrosion resistance, high thermal conductivity, and the non-toxicity of its compounds. In particular, these properties have made aluminum extremely popular in the manufacture of cookware, aluminum foil in the food industry, and for packaging. The first three properties have made aluminum the main raw material in the aviation and aerospace industries (recently, it has been replaced by composite materials, primarily carbon fiber). After construction and packaging production—aluminum cans and foil—the largest consumer of metal is the energy sector.
For a more detailed overview of global aluminum production from 1970 to 2024, see the video on the Experts Club YouTube channel.

In 2025, Ukrainian companies increased imports of copper and copper products in monetary terms by 23.2% compared to the previous year, to $173.453 million. Copper exports for the same period grew by 17.7%, to $103.848 million.
In December alone, imports amounted to $13.311 million, while exports amounted to $10.318 million.
As reported, Ukraine maintained copper imports at the previous year’s level ($140.797 million) in 2024, and in 2023, it increased them by 2.2 times compared to 2022.
Copper is widely used in electrical engineering, in the production of pipes, for creating alloys, in medicine, and in other industries.
Earlier, the Experts Club information and analytical center released a video dedicated to global copper production and leading producing countries – https://youtube.com/shorts/_h8iU50z8C0?si=a-XkgGEfeUxseQNa

Gold and silver prices hit new highs on Monday amid increased demand for safe-haven assets due to the situation surrounding Greenland.
Traders fear that increased pressure from US President Donald Trump, who is laying claim to Greenland, will provoke a large-scale trade war between the US and Europe.
On Saturday, Trump announced that he would impose 10% tariffs on a number of European countries that support Denmark and Greenland starting in February. From June 1, 2026, the tariffs for these countries will be 25% and will remain in effect “until an agreement is reached on the full purchase of Greenland by Washington,” Trump said.
European countries are ready for a coordinated response to the introduction of US tariffs, said European Commission President Ursula von der Leyen. According to the Financial Times, EU countries are considering imposing tariffs on US goods worth €93 billion or a series of restrictions on American companies.
The trade tensions surrounding Greenland are different from last year’s situation with the US imposing large-scale tariffs, notes Charu Chanan, chief investment strategist at Saxo Markets in Singapore.
“The use of tariff threats within NATO is a kind of blow to confidence that could provoke a more persistent risk premium on asset values,” she says.
The spot price of gold rose 1.6% to $4,670.47 per ounce by 9:30 a.m. on Monday, while silver rose 3.4% to $93.1755 per ounce. During the session, the price of gold rose to a record $4,690.59 per ounce, and silver to $94.1213 per ounce.
“Geopolitical risks are intensifying,” said Kyle Rodda, an analyst at Capital.com Inc. in Melbourne. “New trade uncertainty is clouding the growth outlook, and US foreign policy is undermining confidence in the dollar. This is the perfect set of conditions for gold and silver prices to rise.”
US stock index futures are down 0.8-1.3% on Monday. Trading activity on the futures market is weak as US exchanges are closed for the Martin Luther King Jr. holiday.
Reference: The Experts Club analytical center previously released a video analysis of the twenty largest silver-producing countries and their competition for leadership in 1971-2024 – https://www.youtube.com/shorts/HvKK-YET8vs
The Experts Club also previously presented an analysis of the world’s leading gold-producing countries — https://youtube.com/shorts/DWbzJ1e2tJc?si=BywddHO-JFWFqUFA
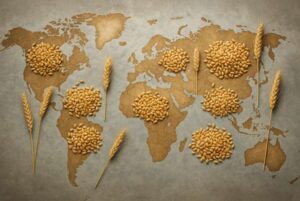
In its January review, the International Grains Council (IGC, headquartered in London) raised its forecast for global grain harvest in 2025/26 (July-June) by 31 million tons to a record 2 billion 461 million tons.
This is primarily due to improved forecasts for corn harvests, mainly in the US and China, and barley harvests in Canada and Australia.
In the 2024/25 season, the harvest amounted to 2 billion 238 million tons.
“Thanks to an increase in yield (by 5%) and an increase in acreage (by 1%), the grain harvest in the 2025/26 season will break all existing records. In addition to record corn and wheat harvests, barley and sorghum harvests are also expected to reach multi-year highs,” the review says.
The estimate for grain consumption has been raised by 16 million tons to 2.416 billion tons. Carryover stocks at the end of the season are forecast at 634 million tons, which is almost 16 million tons higher than the previous estimate.
Global trade this season is estimated at 446 million tons, which is 4 million tons higher than the previous forecast and 5% higher on an annualized basis.
The wheat harvest forecast has risen to 842 million tons, which is 12 million tons higher than the previous estimate. In the 2024/25 season, the harvest amounted to 801 million tons. “It is expected that in the 2026/27 season, the area sown with wheat will decrease slightly, and assuming average yields in the next season, the harvest is preliminarily forecast to decline by about 2%,” the review says. “As demand has reached a new peak, a slight reduction in global stocks is expected, but aggregate stocks in major exporting countries will remain at comfortable levels.”
The corn harvest forecast for the 2025/26 season has been raised to 1.313 billion tons from the previous 1.298 billion tons. Last season, 1.238 billion tons were harvested.
The estimate for global rice production has remained virtually unchanged at 543 million tons. Taking into account a slight decline in consumption, stocks at the end of the 2025/26 season will increase by 2 million tons. Expectations for global trade volume in calendar year 2026 have declined slightly, but at 60 million tons (a 2% increase), it will still be a record high, the review notes.
Earlier, the Experts Club analytical center presented a video analysis of global grain production by leading agricultural countries in the period 1991-2024. The video is available here: https://youtube.com/shorts/2XwiBWf9GrM?si=F9-QsXbWRl2jqV8M
The Ukrainian passive fire protection market in 2025, according to preliminary estimates, is worth $8-12 million, with the share of imported materials falling from 80% in 2016 to 17% in 2025, according to the Experts Club analytical centre.
‘Local production reduces costs compared to imported counterparts, which is especially important for large-scale restoration projects,’ said Konstantin Kalafat, co-owner and director of Kovlar Group, quoted in the article.
According to an analytical study by the Ukrainian manufacturer of passive fire protection products, Kovlar Group, based on the interim results of the Ukraine Recovery Conference 2025 in Rome, provided that the hostilities end, the market could grow to $25 million by 2026. It is expected that the demand structure will be dominated by specialised fire-retardant paints (70-80%), fire-retardant plasters and slabs – 5-10%; passage sealing and communication protection systems – 5-10%; ventilation, smoke ducts and wood protection products – about 5%. An additional driver may be the growing demand for epoxy and polyurethane fire protection systems for oil and gas infrastructure, energy and strategic facilities – a segment that was previously limited by the high cost of imported analogues.
Experts Club notes that against the backdrop of war and logistical constraints, import substitution continues, and in 2025, Ukrainian manufacturers and international brands were simultaneously present on the market through suppliers and certified systems, in particular Ammokote, Hensotherm, Defens, Promapaint, and Steelguard. The leader of the segment in public estimates is Kovlar Group, which claims a share of about 65% of the Ukrainian fire protection materials market and a portfolio of more than 25 items of fire protection products and related materials; other notable Ukrainian manufacturers include Kapitel Dnipro and NVP Spetsmaterialy.
EXPERTS CLUB, fire protection material, Kovlar Group, Калафат