
From September 1 to 21, 2026, Ukraine exported 1.6 million metric tons of agricultural products, which represents 43% of the volume that would have been exported had the logistics system been operating at full capacity, Minister of Agrarian Policy and Food Taras Vysotsky said at a briefing on Thursday.
He specified that 275,000 metric tons of oilseeds were shipped abroad, or 75% of the volume that would have been exported under normal logistics conditions; 190,000 metric tons of oil (55%); 173,000 metric tons of meal (41%); while grain exports totaled 960,000 metric tons (38%).
“We see that the share of grains (compared to potential volumes – IF-U) is the smallest, and, accordingly, the share of oilseeds, oil, and meal is larger. Therefore, yes, as of today, the priority remains on exporting value-added products,” Vysotsky said.
As reported, during the first 15 days of September, Ukraine exported 131,000 metric tons of oil, which accounted for 62% of the volume that would have been exported during this period if the ports had been operating freely.
As of September 21, Ukraine had exported 4.662 million metric tons of grains and legumes since the start of the 2026/27 marketing year (MY, July 2026 – June 2027), had exported 4.662 million metric tons of grains and legumes as of September 21, which is 22% less than the 5.979 million metric tons recorded as of September 24, 2025, according to the press service of the Ministry of Agrarian Policy and Food.
At the same time, corn exports rose by 103.4%—to 1.841 million metric tons, compared to 905,000 metric tons as of September 24, 2025.
Wheat exports since the start of the 2026/27 marketing year totaled 2.337 million metric tons, a 43.9% decrease compared to 4.168 million metric tons as of September 24, 2025. Barley exports totaled 420,000 metric tons, down 46.9% from last year’s figure of 791,000 metric tons.
Wheat flour exports since the start of the 2026/27 marketing year totaled 6,800 metric tons, down 48.9% from 13,300 metric tons as of September 24, 2025. Exports of other types of flour remained at 0.6 thousand metric tons. Overall, flour exports fell by 46.8%—to 7.4 thousand metric tons, compared to 13.9 thousand metric tons as of September 24, 2025.

As of September 22, Ukrainian farmers had threshed 7 million hectares, or 61% of the projected area, according to the press service of the Ministry of Agrarian Policy and Food.
The gross harvest of grains and legumes totaled 32.95 million metric tons, with an average yield of 47 ts/ha.
Wheat harvests totaled 25.31 million metric tons from 5.11 million hectares at an average yield of 49.5 centners per hectare, while barley harvests totaled 6.39 million metric tons from 1.48 million hectares at a yield of 43.3 centners per hectare. The harvest of these crops is complete.
Peas were harvested at 812,200 metric tons from an area of 301,900 hectares, with an average yield of 26.9 centners per hectare; millet—62,200 metric tons from 26,900 hectares, with a yield of 23.2 centners per hectare; buckwheat—37,100 metric tons from 26,600 hectares at a yield of 13.9 centners per hectare, and corn—339,800 metric tons from 67,900 hectares at a yield of 50 centners per hectare.
Farmers in the southern and central regions harvested the largest volumes of grain. In the Odesa region, 4.83 million metric tons of grain were harvested from an area of 1.19 million hectares; in the Dnipropetrovsk region, 2.72 million metric tons from 663,300 hectares; and in the Kirovohrad region, 2.43 million metric tons from 561,000 hectares.
The highest average grain yields were recorded in farms in the Khmelnytskyi region (70.6 centners per hectare), the Sumy region (60.6 centners per hectare), and the Kyiv region (55.8 centners per hectare).
More than 6 million metric tons of oilseeds were harvested from approximately 2.4 million hectares. In particular, the rapeseed harvest has been completed, with 3.857 million metric tons harvested from 1.33 million hectares at a yield of 29 centners per hectare.
Sunflower seeds totaled 1.5 million metric tons from 756,200 hectares—or 14% of the projected area—at a yield of 19.8 centners per hectare.
Soybeans totaled 655,400 metric tons from 327,600 hectares—or 21% of the projected area—at a yield of 20 centners per hectare.
Farmers have also begun harvesting sugar beets. 19.3 thousand metric tons have been harvested from an area of 0.45 thousand hectares, with an average yield of 428.9 centners per hectare.
In September, the U.S. Department of Agriculture raised its forecast for feed grain production in Ukraine for the 2026/27 marketing year by 0.5 million metric tons—to 39.09 million metric tons, according to data from the WASDE report.
The USDA includes corn, barley, sorghum, oats, rye, millet, and mixed grains in this category. Since the corn production forecast for Ukraine remained unchanged at 31.8 million metric tons, production of other feed grains is estimated at approximately 7.29 million metric tons, compared with about 6.79 million metric tons in the August forecast.
The USDA explicitly states that in September it raised its estimate for barley production in Ukraine, as well as in Australia and Kazakhstan.
At the same time, the forecast for total feed grain exports from Ukraine has been lowered from 24.27 million metric tons to 23.77 million metric tons. Since corn exports are still estimated at 22 million metric tons, other feed grains account for about 1.77 million metric tons of exports, which is 0.5 million metric tons less than the August estimate.
Total domestic consumption of feed grains in Ukraine has been raised from 11.24 million metric tons to 11.34 million metric tons, while the forecast for ending stocks has been raised from 7.13 million metric tons to 8.63 million metric tons.
This figure of 8.63 million metric tons includes corn, for which the USDA estimates ending stocks at 5.46 million metric tons. Consequently, the remaining feed crops account for approximately 3.17 million metric tons of ending stocks.
The increase in production, coupled with a downward revision of the export forecast, suggests that grain supply in Ukraine’s domestic market is likely to rise in the 2026/27 marketing year.
Source: USDA WASDE-675, published on September 11, 2026: official USDA report
In its September forecast, the U.S. Department of Agriculture (USDA) raised its estimate for wheat production in Ukraine in the 2026/27 marketing year by 0.6 million metric tons compared to August—to 26 million metric tons—but at the same time lowered its forecast for Ukrainian exports by 1 million metric tons—to 12.5 million metric tons.
According to the September World Agricultural Supply and Demand Estimates (WASDE) report, published by the USDA on September 11, 2026, the upward revision of the harvest forecast is due to record-high yields of Ukrainian wheat as the harvest nears completion. In August, the agency had estimated production at 25.4 million metric tons.
The forecast for domestic consumption of Ukrainian wheat has been raised from 9.2 million metric tons to 9.5 million metric tons, including feed consumption—from 4.2 million metric tons to 4.5 million metric tons.
At the same time, the USDA significantly raised its forecast for Ukraine’s ending wheat stocks—from 4.8 million metric tons in the August forecast to 6.1 million metric tons in September. Imports are expected to total 0.1 million metric tons.
Thus, despite the improved harvest estimate, the additional production is not translating into a corresponding increase in exports and is largely contributing to a buildup in domestic stocks.
The USDA attributes the downward revision of Ukraine’s export estimate—as well as Russia’s—to slow shipment rates in August and logistical challenges in the Black Sea region due to the ongoing war.
Ukraine remains one of the largest suppliers of wheat to the global market. According to the USDA forecast, global wheat trade in the 2026/27 marketing year will total approximately 211.8 million metric tons.
Source: USDA WASDE-675 report dated September 11, 2026: USDA WASDE September 2026
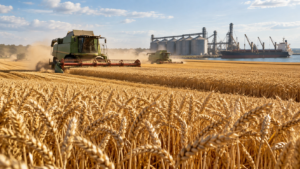
Global wheat production in the 2026/27 marketing year will total 822.43 million metric tons, which is 3.13 million metric tons higher than the U.S. Department of Agriculture’s August forecast, according to the Experts Club information and analytical center.
According to the September USDA report, one of the main factors behind the revision was an improvement in the crop outlook in Australia. The forecast for the country was raised by 3 million tonnes at once — from 28 million tonnes to 31 million tonnes thanks to favorable weather conditions.
For Canada, the production forecast was increased by 1 million tonnes — to 36 million tonnes, and for Ukraine — by 0.6 million tonnes, to 26 million tonnes. At the same time, the forecast for Kazakhstan was reduced by 1 million tonnes — to 15 million tonnes, and for Russia — by 0.5 million tonnes, to 88 million tonnes.
Despite the increase in production, the forecast for global wheat trade was reduced by approximately 0.9 million tonnes — to 211.77 million tonnes.
USDA cut its estimates for Russia’s exports from 46 million tonnes to 43 million tonnes, Ukraine’s — from 13.5 million tonnes to 12.5 million tonnes, as well as Kazakhstan’s. The decline is partially offset by increased exports from Australia, Canada and Argentina.
The U.S. agency explained the deterioration in the outlook for Russian and Ukrainian exports by weak August shipments amid the fact that the war in the Black Sea region is complicating logistics.
Global wheat consumption is forecast at 826.75 million tonnes, while ending stocks were increased by approximately 3 million tonnes — to 276.29 million tonnes. The main increase in stocks is expected in Russia, Australia and Ukraine.
Primary source — USDA World Agricultural Supply and Demand Estimates dated September 11, 2026: WASDE-675, September 2026



