
The Czech Republic and Moldova have the highest net sentiment—the balance of positive and negative attitudes—among Ukrainians among the Central and Eastern European countries included in the study—56.2 and 48.2 percentage points, respectively. At the same time, the balance of attitudes toward Poland turned negative in August 2026, while assessments of Slovakia and Hungary improved significantly compared to previous waves. This is evidenced by the results of the third wave of the study “Ukrainians’ Attitudes Toward Countries Around the World,” conducted by Active Group in collaboration with Experts Club, according to the Experts Club Information and Analytical Center.
The Czech Republic received the highest share of positive assessments in this group—61.3%. 32.1% of respondents have a neutral attitude toward it, 5.1% have a negative attitude, and another 1.6% were undecided. The balance of positive and negative attitudes stands at 56.2 percentage points, compared to 64.4 percentage points in March 2026 and 58.7 percentage points in August 2025.
Regarding Moldova, 55.4% of respondents have a positive attitude, 35.6% are neutral, and 7.2% have a negative attitude. The balance stands at 48.2 percentage points, which is lower than the 54.7 percentage points recorded in March but higher than the 46.6 percentage points recorded in August of last year.
Regarding Romania, 45.2% of respondents expressed a positive attitude, 42.3% were neutral, and 9.8% were negative. The balance fell to 35.4 percentage points from 41.7 percentage points in March. In Bulgaria, positive assessments accounted for 42.7%, neutral ones for 47.6%, and negative ones for 7.4%, with the balance standing at 35.3 percentage points, compared to 51.5 percentage points in March.
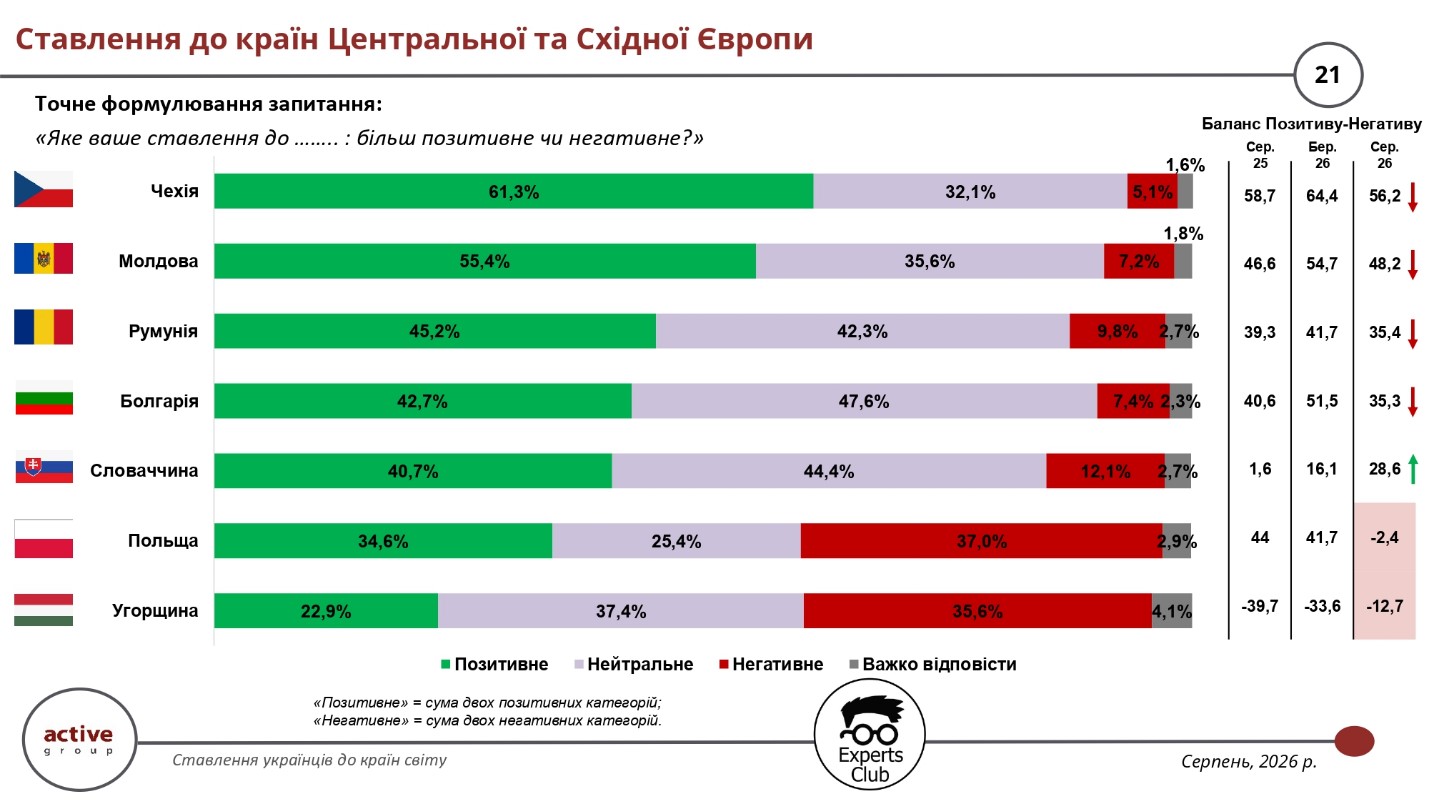
Unlike most countries in the group, attitudes toward Slovakia showed a noticeable improvement. It is viewed positively by 40.7% of respondents, negatively by 12.1%, and neutrally by 44.4%. The balance rose to 28.6 percentage points from 16.1 percentage points in March 2026 and just 1.6 percentage points in August 2025.
The sharpest negative trend was recorded regarding Poland. 34.6% of Ukrainians view it positively, 37% negatively, and 25.4% neutrally. As a result, the net balance stands at minus 2.4 percentage points, whereas in March 2026 it was plus 41.7 percentage points, and in August 2025—plus 44 percentage points. The deterioration in attitudes toward Poland was one of the most notable shifts in the third wave of the survey.
Hungary remains in the negative zone: 22.9% of respondents expressed a positive attitude, 35.6% a negative one, and 37.4% a neutral one. At the same time, its balance improved to minus 12.7 percentage points compared to minus 33.6 percentage points in March and minus 39.7 percentage points in August 2025.
Maksym Urakin, founder of the Experts Club Information and Analytical Center, deputy director of the Interfax-Ukraine news agency, and candidate of economic sciences, emphasized that public perception of countries must be analyzed in parallel with Ukraine’s actual economic ties.
“That is why it is very important for us to analyze our main partners. The first recommendation is to regularly showcase concrete projects, specific actions, and the presence here of foundations, embassies, teams, and diplomats in the humanitarian sphere and in science. We also need to use our sociological data to draw conclusions and strengthen our relations, particularly trade relations,” Urakin noted.
Oleksandr Pozniy, director of the research firm Active Group, highlighted the practical significance of the study’s findings for economic and diplomatic policy.
“We should focus on developing more than just general awareness. First and foremost, business associations, the Ministry of Economy, and the Ministry of Foreign Affairs need to work to develop bilateral relations and improve the balance of trade. We must expand cooperation with countries where we can achieve a positive trade balance,” Pozniy noted.
The survey was conducted in August 2026 using self-administered online questionnaires in the SunFlowerSociology panel among 800 Ukrainian citizens aged 18 and older. According to the organizers, the sample is representative by age, gender, and region, with a maximum theoretical margin of error of 3.5%. This is the third wave of the study, following surveys conducted in August 2025 and March 2026.
ACTIVE GROUP, BULGARIA, Central Europe, CZECH REPUBLIC, EASTERN EUROPE, EXPERTS CLUB, HUNGARY, MOLDOVA, POLAND, Pozniy, ROMANIA, SLOVAKIA, SOCIOLOGY, UKRAINE, URAKIN
According to Experts Club, Ukrainians’ attitudes toward the United Kingdom, the Scandinavian countries, and the Baltic states remain predominantly positive: in August 2026, the share of positive assessments for the countries included in the study ranged from 66.9% to 72.6%. At the same time, the balance between positive and negative attitudes toward all countries in this group has declined slightly compared to the previous survey wave in March 2026. This is evidenced by the results of a study conducted by Active Group and the Experts Club Information and Analytical Center, reports the Experts Club Information and Analytical Center.
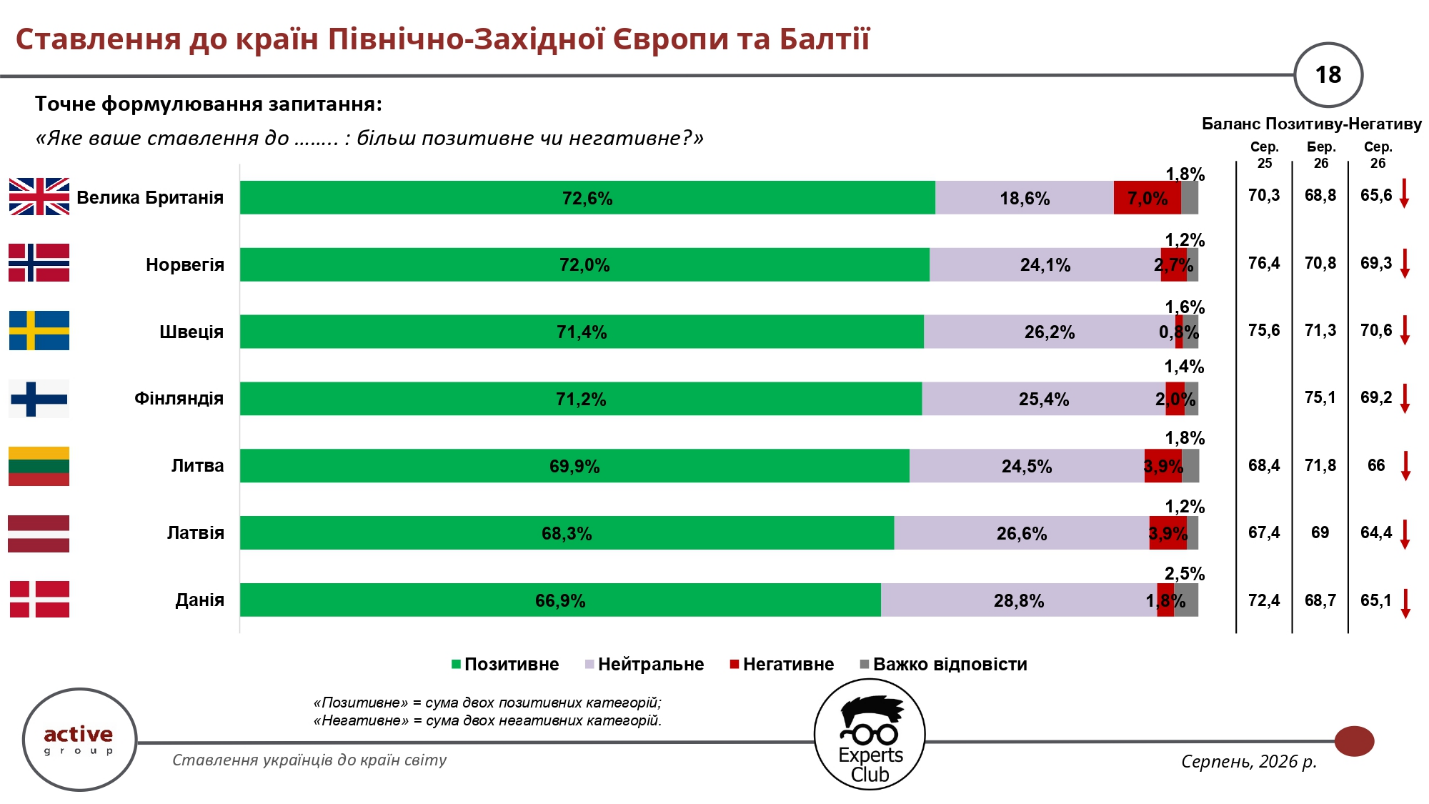
The United Kingdom received the highest share of positive assessments in the group—72.6%. 18.6% of respondents had a neutral attitude toward it, 7% had a negative attitude, and another 1.8% were undecided. The balance of positive and negative assessments stands at 65.6 percentage points, compared to 68.8 percentage points in March 2026 and 70.3 percentage points in August 2025.
Seventy-two percent of Ukrainians view Norway positively, while only 2.7% view it negatively, resulting in a balance of 69.3 percentage points. In March, this balance stood at 70.8 percentage points, and in August of last year, at 76.4 percentage points. Sweden has 71.4% positive and only 0.8% negative assessments—its balance stands at 70.6 percentage points and is the highest among the countries presented on the slide. Overall, the study records approximately 67–73% positive ratings for the countries of Northwestern Europe and the Baltic states.
71.2% of respondents view Finland positively, 25.4% neutrally, and 2% negatively. The balance stands at 69.2 percentage points, down from 75.1 percentage points in March. Lithuania is viewed positively by 69.9% of respondents and negatively by 3.9%; the balance fell from 71.8 percentage points in March to 66 percentage points in August.
A positive attitude toward Latvia was expressed by 68.3% of respondents, a neutral one by 26.6%, and a negative one by 3.9%. Its balance stands at 64.4 percentage points, compared to 69 percentage points in March. For Denmark, the corresponding figures are 66.9% positive, 28.8% neutral, and 1.8% negative assessments, with a balance of 65.1 percentage points, compared to 68.7 percentage points in the previous survey wave.
Maksym Urakin, founder of the Experts Club Information and Analytical Center, deputy director of the Interfax-Ukraine news agency, and candidate of economic sciences, emphasized the importance of constant communication between foreign partners and Ukrainian society.
“The first recommendation is to regularly showcase concrete achievements and concrete actions. Second, be open to questions and inquiries from the media and the public,” Urakin noted. According to him, the results of sociological surveys can be used to strengthen bilateral relations, particularly trade relations.
Alexander Pozniy, director of the research company Active Group, also drew attention to the need to combine public perceptions of countries with the development of practical economic cooperation.
“We should do more than just raise general awareness. We need to expand cooperation with countries where we can maintain a positive balance,” Pozniy noted. He also emphasized the role of business associations and government agencies in developing bilateral economic ties.
Overall, the results show that Northern and Northwestern Europe, along with the Baltic states, continue to enjoy a high level of positive perception among Ukrainians. At the same time, the decline in the balance compared to March 2026 indicates that even regarding countries with traditionally high ratings, public opinion is not static. In the overall ranking, Sweden, Finland, Norway, Lithuania, and the United Kingdom were among the top ten countries with the highest net sentiment.
The survey was conducted in August 2026 using self-administered online questionnaires via the SunFlowerSociology panel. It included 800 Ukrainian citizens aged 18 and older. The sample is representative by age, gender, and region; the stated maximum theoretical margin of error is ±3.5 percentage points. This is the third wave of the study, following surveys conducted in August 2025 and March 2026.
ACTIVE GROUP, DENMARK, EXPERTS CLUB, FINLAND, LATVIA, LITHUANIA, NORWAY, SOCIOLOGY, SWEDEN, UKRAINE, UNITED KINGDOM
According to Experts Club, China ranked last among Ukraine’s 50 largest trading partners in terms of the balance of positive and negative attitudes among Ukrainians—in August 2026, the figure stood at minus 25.4 percentage points. The next lowest results were recorded for India and Hungary—minus 14.3 and minus 12.7 percentage points, respectively. This is evidenced by the results of the third wave of the study “Ukrainians’ Attitudes Toward Countries Around the World,” conducted by Active Group in collaboration with Experts Club, reports the Experts Club Information and Analytical Center.
The balance was defined as the difference between the shares of positive and negative assessments. Regarding China, 18.2% of respondents expressed a positive attitude, 43.6% a negative one, and another 33.9% a neutral one. Thus, China received the lowest score among all countries surveyed, despite the fact that in the first half of 2026, China was Ukraine’s largest trading partner with a trade volume of approximately $14.68 billion.
The top ten countries with the lowest scores also included Lebanon—minus 9.2 percentage points—and Poland—minus 2.3 percentage points. Serbia, Algeria, Libya, Vietnam, and Tunisia remained in the positive range, however, their scores were among the lowest among the countries surveyed: Serbia at plus 2.3 percentage points, Algeria at plus 2.2, Libya at plus 1.0, Vietnam at plus 9.4, and Tunisia at plus 11.0 percentage points.
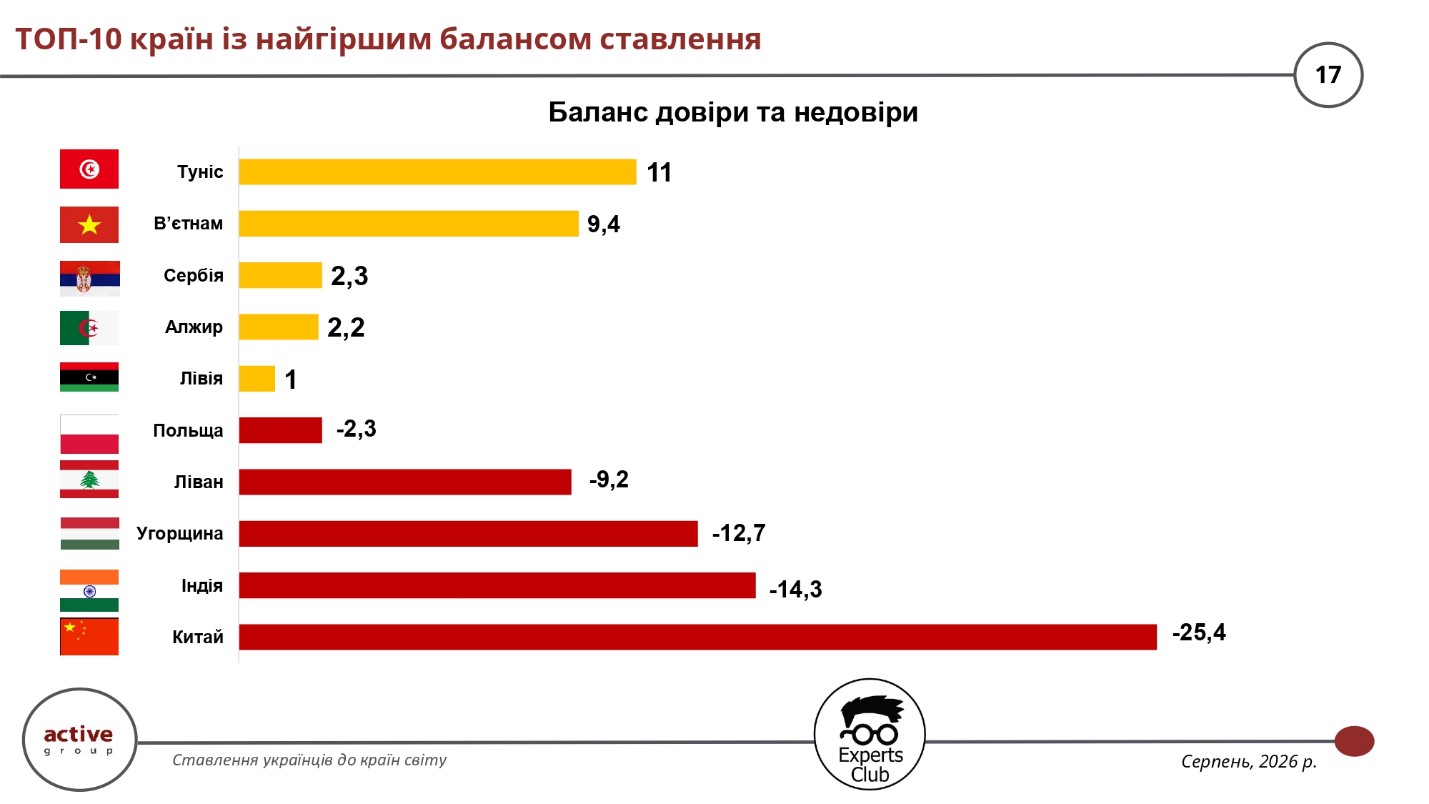
The shift in attitudes toward Poland was particularly noticeable. In March 2026, the balance of positive and negative assessments stood at +41.7 percentage points, whereas in August it fell to –2.3 percentage points. A positive attitude toward Poland was expressed by 34.6% of respondents, a negative one by 37%, and a neutral one by 25.4%. At the same time, Poland remains one of Ukraine’s largest trading partners and the largest market for Ukrainian goods exports among individual countries in the first half of 2026.
Maksym Urakin, founder of the Experts Club Information and Analytical Center, deputy director of the Interfax-Ukraine news agency, and candidate of economic sciences, noted that the results of the sociological survey should be analyzed in conjunction with actual trade figures.
“Second, we must be open to questions and inquiries from the media and the public. We also need to make use of our sociological research,” Urakin noted. In his view, systematic communication and the demonstration of concrete results of cooperation can help governments better explain the nature of bilateral relations to Ukrainian society.
Oleksandr Pozniy, director of the research company Active Group, highlighted the need to combine public awareness with the practical development of economic ties.
“We need to do more than just raise general awareness. We must expand cooperation with countries where we can achieve a positive trade balance,” Pozniy noted. He emphasized the role of business associations, economic institutions, and diplomatic missions in developing bilateral ties, especially with markets where Ukraine can increase its exports.
Overall, the survey results show that the scale of trade and economic ties does not always correspond to public attitudes toward the respective country. China stands out as the most striking example: it has the highest trade volume among individual partners, yet is simultaneously associated with the lowest ratings among Ukrainians.
The survey was conducted in August 2026 using self-administered online questionnaires in the SunFlowerSociology panel among 800 Ukrainian citizens aged 18 and older. The sample is representative by age, gender, and region; the maximum theoretical margin of error for indicators at the 50% confidence level is ±3.5 percentage points. This is the third wave of the study, following surveys conducted in August 2025 and March 2026.
ACTIVE GROUP, CHINA, EXPERTS CLUB, FOREIGN TRADE, HUNGARY, INDIA, international relations, POLAND, SOCIOLOGY, UKRAINE
Canada ranked first among countries with the highest net positive sentiment among Ukrainians—in August 2026, this figure stood at 73.8 percentage points. The top ten also included mainly countries from Northern and Western Europe, according to the results of the third wave of the study “Ukrainians’ Attitudes Toward Countries Around the World,” conducted by Active Group in collaboration with Experts Club, reports the Experts Club Information and Analytical Center.
Sweden took second place in terms of the balance of trust and distrust with a score of 70.6 percentage points, while the Netherlands came in third with 69.7 percentage points. Finland and Norway each scored 69.3 points, France scored 69.1 points, Italy scored 67.1 points, and Lithuania scored 65.9 points. Rounding out the top ten are Switzerland and the United Kingdom, which both scored 65.6 percentage points.
The sentiment score is calculated as the difference between the proportion of positive and negative ratings. Specifically, 76.3% of respondents view Canada positively, 2.5% negatively, and 19.2% neutrally. Thus, Canada’s high score is due not only to a significant proportion of favorable ratings but also to a minimal level of negative sentiment.
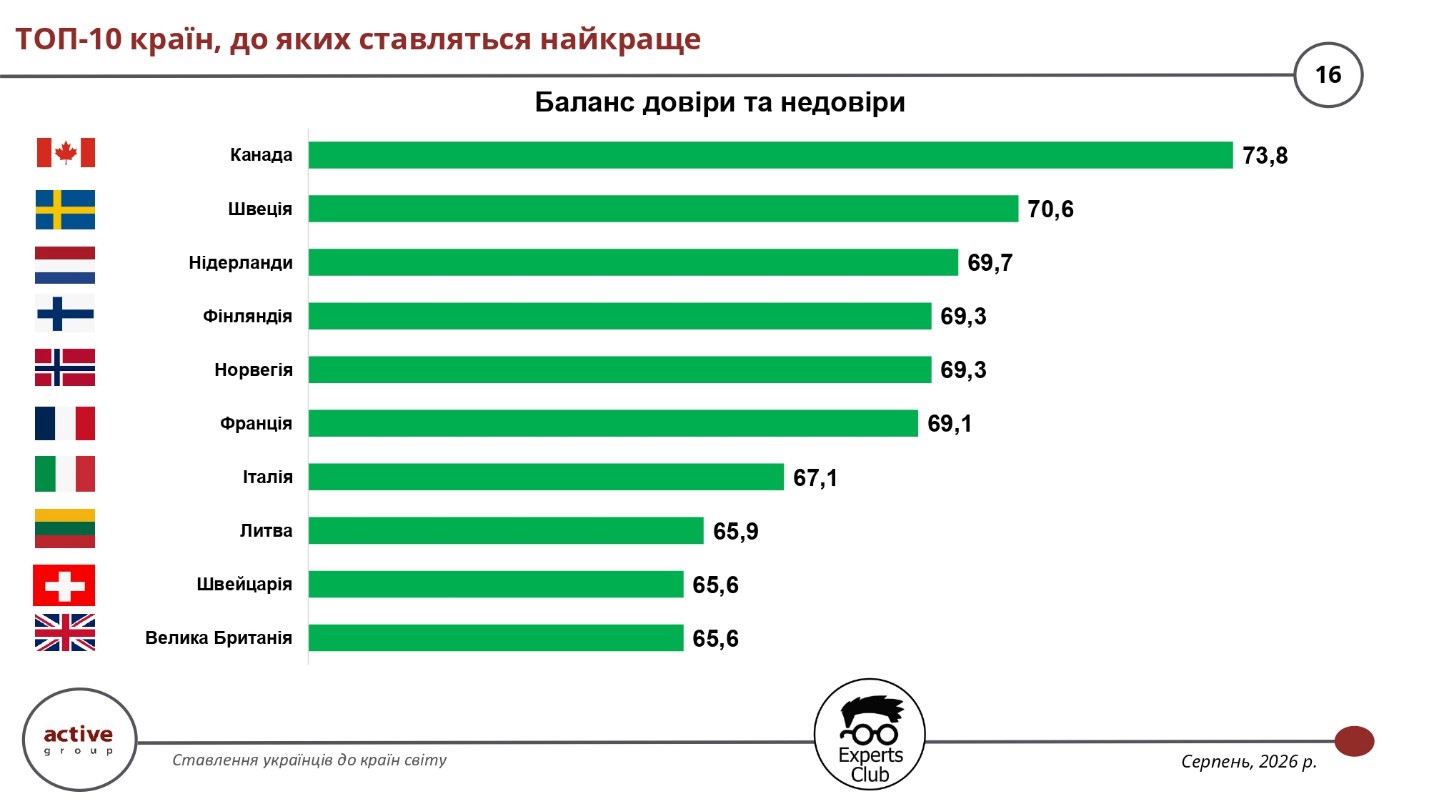
The survey results show that the top ten countries with the most favorable balance of attitudes consist almost entirely of countries in Northern and Western Europe, along with Canada. At the same time, the level of public favor does not always directly correspond to the scale of Ukraine’s trade and economic ties with a specific country. For example, China was Ukraine’s largest trading partner in the first half of 2026, yet it received the lowest balance of positive and negative assessments—minus 25.4 percentage points.
Maksym Urakin, founder of Experts Club, deputy director of the Interfax-Ukraine news agency, and candidate of economic sciences, emphasized that studies of public perception should be considered alongside actual foreign trade indicators.
“That is why it is very important for us to analyze our main partners. We must be open to questions and inquiries from the media and the public,” Urakin noted. According to him, the results of sociological surveys can be used to assess international relations and their further development.
Alexander Pozniy, Director of Active Group, drew attention to the need to combine the creation of a positive image of countries with the practical development of bilateral economic ties.
“We should focus on developing more than just general awareness. We need to expand cooperation with countries where we can achieve a positive balance,” Pozniy noted. According to him, both government agencies and business associations should be involved in this process.
The survey was conducted in August 2026 using self-administered online questionnaires via the SunFlowerSociology panel. A total of 800 Ukrainian citizens aged 18 and older were surveyed. According to the organizers, the sample is representative in terms of age, gender, and region; the maximum theoretical statistical margin of error at a 95% confidence level is 3.5%. This is the third wave of the survey, following surveys conducted in August 2025 and March 2026.
ACTIVE GROUP, CANADA, EXPERTS CLUB, FINLAND, international relations, NORWAY, SOCIOLOGY, SWEDEN, THE NETHERLANDS, UKRAINE, URAKIN
European Union countries and the United Kingdom remain the top foreign economic priority for Ukrainians: in August 2026, 69.9% of respondents noted the need to prioritize the development of trade and economic relations with these countries. This is evidenced by the results of the third wave of the study “Ukrainians’ Attitudes Toward Countries Around the World,” conducted by Active Group in collaboration with the Experts Club Information and Analytical Center, according to the Experts Club Information and Analytical Center.
At the same time, support for the European direction has declined compared to previous waves of the study. In August 2025, 82.8% of respondents cited EU countries and the United Kingdom; in March 2026, 81.1%; and in August, 69.9%. Thus, over the course of a year, the figure decreased by 12.9 percentage points.
The trend regarding the United States is even more pronounced. In August 2025, 58.8% of respondents supported prioritizing the development of trade and economic relations with the United States; in March 2026, this figure was 59.2%, while in August it stood at 11.9%.
In August 2026, 8.4% of respondents named China as a priority, compared to 35.4% in March and 26.7% in August of the previous year. At the same time, China remains one of Ukraine’s most important trading partners, highlighting the discrepancy between the actual structure of foreign trade and public perceptions of the desired directions for its development.
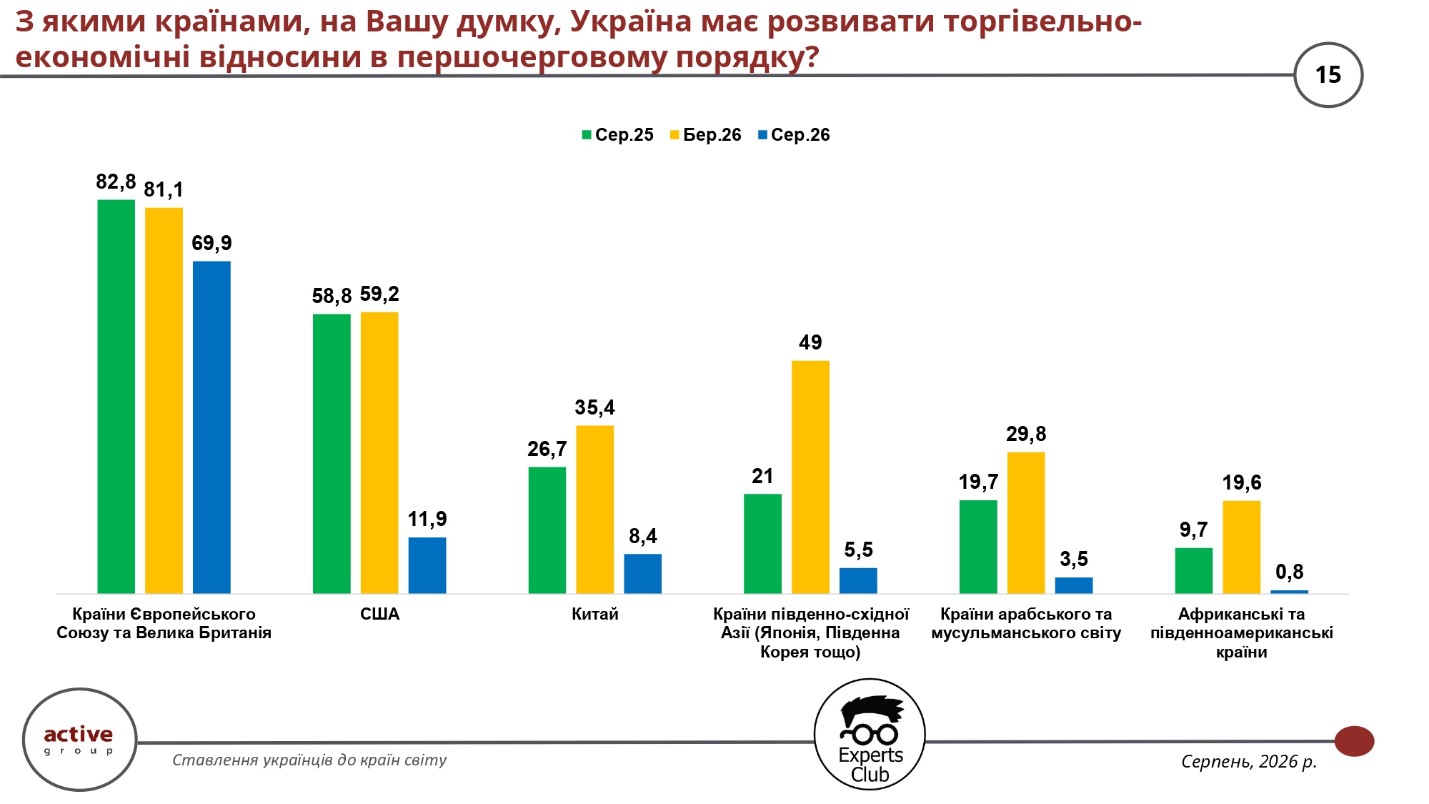
Another 5.5% of those surveyed in August advocated for prioritizing the deepening of economic relations with countries in Southeast Asia—Japan, South Korea, and other nations in the region. In March, this figure stood at 49%, and a year earlier—at 21%. Countries in the Arab and Muslim world were cited by 3.5% of respondents, compared to 29.8% in March, while African and South American countries were cited by 0.8%, compared to 19.6%.
Maksym Urakin, founder of the Experts Club information and analytical center, emphasized the need for more active communication between international partners and Ukrainian society.
“We need to regularly showcase concrete achievements and specific actions. Openness toward the media and the public helps strengthen relations, particularly trade relations,” Urakin noted.
According to him, sociological surveys can serve as a practical tool for government agencies, diplomatic missions, and the business community in determining the direction of bilateral relations.
Oleksandr Pozniy, director of the research firm Active Group, also highlighted the need to strengthen the economic component of international cooperation.
“We need to do more than just raise general awareness. Businesses and government agencies need to work more actively on developing bilateral relations,” Pozniy noted.
The survey was conducted in August 2026 using self-administered online questionnaires via the SunFlowerSociology panel. A total of 800 Ukrainian citizens aged 18 and older were surveyed. The sample is representative by age, gender, and region; the stated maximum theoretical margin of error is ±3.5 percentage points. Previous waves of the survey were conducted in August 2025 and March 2026.
ACTIVE GROUP, CHINA, EUROPEAN UNION, EXPERTS CLUB, FOREIGN TRADE, international relations, SOCIOLOGY, UKRAINE, UNITED KINGDOM, UNITED STATES
European Union countries remain in first place in terms of the share of responses from Ukrainians to the question of who contributes most to achieving peace in Ukraine. In August 2026, 44.6% of respondents named EU countries, 25.2% named the U.S., and 23.3% named the United Kingdom. This is evidenced by the results of the third wave of a survey on Ukrainians’ attitudes toward countries around the world, conducted by Active Group in collaboration with Experts Club, according to the Experts Club Information and Analytical Center.
Compared to March 2026, the ratings have changed significantly. In the spring, 63.4% of respondents named EU countries in this context, 53.8% named the United Kingdom, and 29.6% named the United States. In August, the figures for the EU and the United Kingdom fell by 18.8 and 30.5 percentage points, respectively, while the figure for the United States changed much less—by 4.4 percentage points.
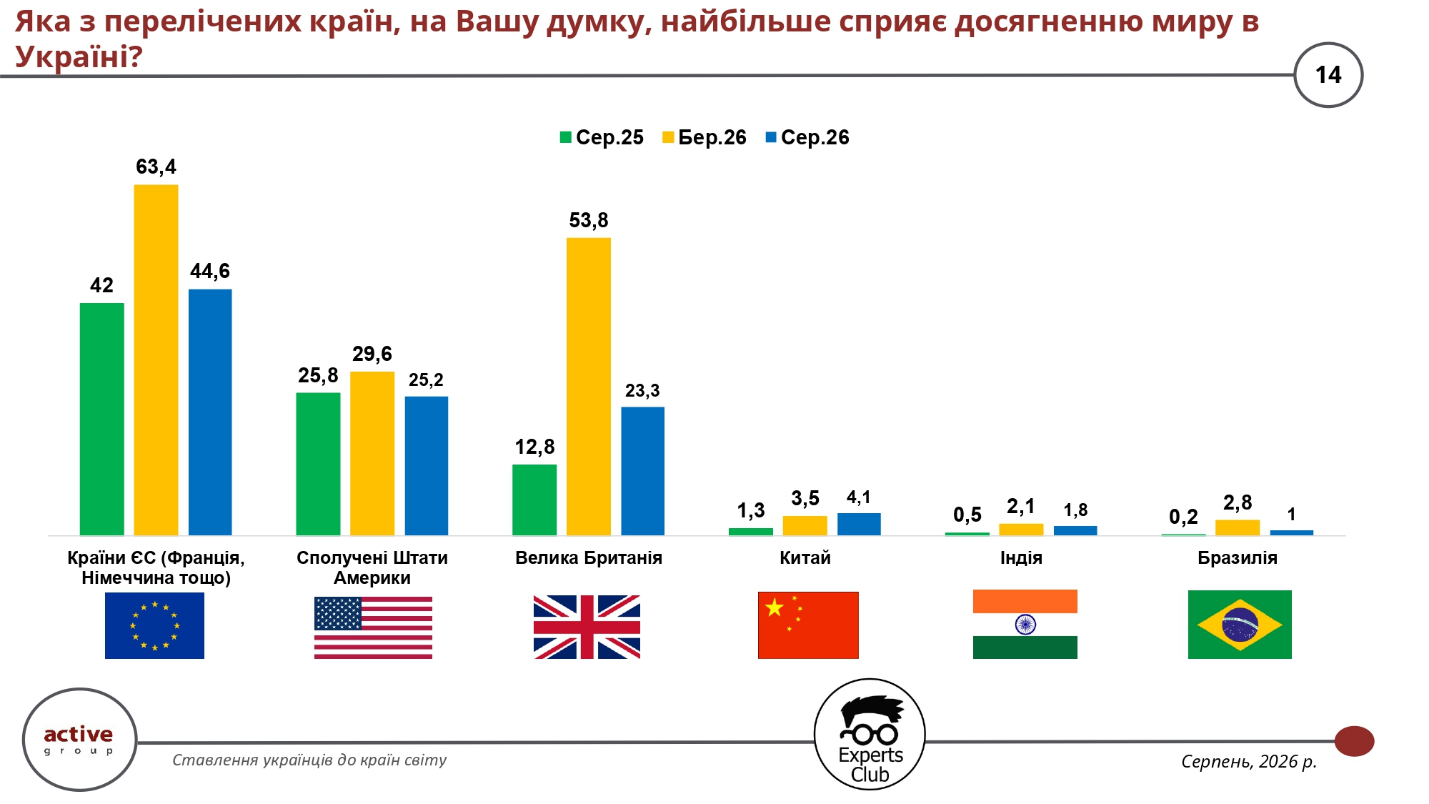
At the same time, compared to August 2025, the share of respondents who named EU countries increased slightly—from 42% to 44.6%. The figure for the U.S. was 25.8% at that time, and for the UK, 12.8%. Thus, the trend in assessments of the UK remains the most dramatic: 12.8% in August 2025, 53.8% in March 2026, and 23.3% in August of this year.
Perceptions of the role of other major powers remain significantly lower. In August 2026, 4.1% of respondents cited China, compared to 3.5% in March and 1.3% a year earlier. The figure for India was 1.8%, and for Brazil, 1%.
Oleksandr Pozniy, director of the research firm Active Group, emphasized that public perceptions of countries should be considered alongside the level of awareness and the actual development of bilateral relations.
“We need to do more than just raise general awareness. First and foremost, business associations, the Ministry of Economy, and the Ministry of Foreign Affairs must work to develop bilateral relations and improve the balance. Given that Ukraine already lacks funding and we are essentially living off foreign loans, we need to expand cooperation with countries where we can achieve a positive balance,” Pozniy noted.
The survey was conducted in August 2026 using self-administered online questionnaires on the SunFlowerSociology panel. It involved 800 Ukrainian citizens aged 18 and older. According to the organizers, the sample is representative in terms of age, gender, and region, and the stated maximum theoretical statistical margin of error is ±3.5 percentage points. This is the third wave of the study, following surveys conducted in August 2025 and March 2026.
ACTIVE GROUP, EUROPEAN UNION, EXPERTS CLUB, international relations, SOCIOLOGY, UKRAINE, UNITED KINGDOM, UNITED STATES, WORLD



