

In July 2026, the state-owned company Ukrnafta increased its diesel fuel imports by 2.4 times compared to July of last year—to nearly 60,000 metric tons—ranking second among the country’s largest importers.
These figures were reported by the “A-95 Consulting Group.” A total of 134 companies imported diesel fuel in July.
The OKKO Group retained first place, importing more than 73,000 metric tons of diesel fuel. Its imports rose by 32% compared to July 2025.
Ukrnafta accounted for about 59,800 metric tons, or approximately 10.6% of the country’s total diesel fuel imports in July.
UPG took third place with 53,200 metric tons. Next came Energo Trade JSC with 50,700 metric tons and WOG with 42,900 metric tons.
Thus, the five largest importers together imported about 280,000 metric tons of diesel fuel—nearly half of the total volume of supplies to Ukraine in July.
Among the major market players, the Western Fuel and Energy Company (ZPEK) demonstrated the highest growth rate, increasing its imports by a factor of 5.3—to approximately 32,000 metric tons.
The sharp increase in Ukrnafta’s purchases comes amid its growing role in the Ukrainian petroleum products market following the expansion of its own network of gas stations and trading operations.
Overall, Ukraine imported 562,000 metric tons of diesel fuel in July—5% more than a year earlier.
However, despite the rise in imports, A-95 reported a fuel shortage in the market. Analysts cite several reasons for this, including increased demand following a rise in global prices, higher purchases by industrial and private consumers, and increased consumption due to the shift in agricultural exports toward road and rail transport.
In August, analysts expect the situation to gradually normalize thanks to a decline in global prices and an increase in fuel supply.
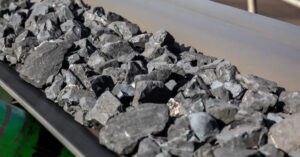
In January–July 2026, Ukraine imported approximately 10.9 thousand metric tons of manganese ore, whereas there were no imports of this product during the same period last year.
According to data from the State Customs Service, virtually the entire volume of shipments came from Ghana—10,896 metric tons worth $1.677 million. An additional 5 metric tons, worth $3,000, were imported from China.
Thus, Ghana accounted for 99.82% of the value of Ukraine’s manganese ore imports in January–July.
The resumption of imports coincides with the recovery of foreign trade in manganese ore overall. Over the seven-month period, Ukraine exported 24,647 metric tons of such products worth $4.227 million.
The average estimated price of exported ore was approximately $171 per metric ton, while that of ore imported from Ghana was approximately $154 per metric ton. These figures are estimates based on customs value and physical shipment volumes and do not reflect differences in the quality and characteristics of the raw material.
Manganese ore imports into Ukraine have fluctuated significantly in recent years. In 2024, the country imported 84,293 thousand metric tons worth $18.302 million.
In 2025, imports fell to 37,006 thousand metric tons, valued at $5.546 million. Notably, the entire volume was shipped from Ghana in November alone, while imports were virtually nonexistent from January through October.
The resumption of shipments as early as the first half of 2026 may indicate growing demand for raw materials in the ferroalloy industry amid a gradual recovery in production.
The main consumers of manganese ore in Ukraine are enterprises in the ferroalloy industry. The Nikopol and Zaporizhzhia Ferroalloy Plants halted smelting after Ukrainian mining companies ceased extraction of raw manganese ore in the fall of 2023; however, ferroalloy production was partially resumed in the summer of 2024.

Ukraine’s trade surplus in ferrous metals and products made from them in January–July 2026 fell by approximately 40% compared to the same period last year—to approximately $465 million.
The calculation is based on data from the State Customs Service of Ukraine.
Over the first seven months, Ukraine exported $1.678 billion worth of ferrous metals and an additional $507.5 million worth of metal products. Total export revenue for these two groups amounted to approximately $2.185 billion.
At the same time, imports of ferrous metals reached $1.023 billion, while imports of ferrous metal products amounted to $697.6 million. Thus, total imports amounted to approximately $1.720 billion.
The difference between exports and imports narrowed to approximately $465 million.
For comparison: based on the annual trends published by the State Customs Service, in January–July 2025, total exports of these two commodity groups amounted to approximately $2.385 billion, imports to approximately $1.612 billion, and the trade surplus to approximately $773 million.
Thus, the annual trade surplus decreased by approximately $308 million, or nearly 40%.
The main reason for this decline is the opposing trends in export and import flows. Total exports of ferrous metals and metal products over the seven-month period decreased by approximately 8.4%, while imports of these goods increased by approximately 6.7%.
The imbalance is particularly noticeable in the metal products segment: exports here totaled $507.5 million, while imports amounted to $697.6 million, resulting in a trade deficit of about $190 million.
Ferrous metals are currently offsetting this deficit: their exports exceed imports by approximately $655 million. However, at the same time, foreign exchange proceeds from their exports fell by 7.6%, while imports rose by 7.2%.
This trend indicates a noticeable decrease in the positive contribution of metallurgical products to Ukraine’s foreign trade balance in 2026.

In January–July 2026, Ukrainian steelmakers saw their foreign exchange revenue from ferrous metal exports decline by 7.6% compared to the same period last year—to $1.678 billion from $1.816 billion.
This is according to data from the State Customs Service of Ukraine.
The share of ferrous metals in Ukraine’s total merchandise export revenue over the first seven months fell to 6.95% from 7.79% in January–July 2025, or by 0.84 percentage points.
Thus, metallurgical products continue to account for a significant portion of Ukraine’s merchandise exports, but their share is shrinking amid a decline in the sector’s foreign exchange earnings.
At the same time, imports of ferrous metals into Ukraine continued to grow. In January–July, they increased by 7.2% to $1.023 billion.
Despite the contrasting trends in exports and imports, Ukraine maintained a positive trade balance in ferrous metals of approximately $655 million over the seven-month period.
The situation with fabricated metal products deteriorated separately. Exports of these products fell by 10.8% to $507.5 million, while imports rose by 6% to $697.6 million. As a result, the foreign trade deficit in fabricated metal products stood at about $190 million.
By comparison, at the end of 2025, export revenue from ferrous metals rose by 7.85% to $3.339 billion, and their share of total merchandise exports reached 8.25%. In 2024, exports of ferrous metals increased by another 16.9%—to $3.096 billion.
Thus, after two years of growth in the metallurgical sector’s export revenues, the trend reversed in 2026: revenues are declining, while imports of ferrous metals and metal products continue to rise.

Ukraine exported $14.1 billion worth of food products in January–July 2026, according to data from the State Customs Service. Based on calculations using State Customs Service statistics, food products accounted for about 58.5% of Ukraine’s total merchandise exports, which amounted to $24.1 billion over the seven-month period.
Metals and metal products ranked second among export categories at $2.5 billion, or slightly more than 10% of total exports.
Machinery, equipment, and transportation vehicles were exported in the amount of $2.1 billion, corresponding to approximately 8.7% of total exports.
Thus, food products, metal products, and machinery collectively accounted for about 77.6% of Ukraine’s merchandise exports.
Poland remained the largest market for Ukrainian goods over the seven-month period, with $2.8 billion worth of products shipped there. Exports to Turkey totaled $2 billion, and to Germany—$1.5 billion.
Overall, Ukrainian exports in January–July 2026 grew by 3.8% compared to the same period last year—rising to $24.1 billion from $23.2 billion.
At the same time, imports grew much faster—by 26.6%, to $58.1 billion.
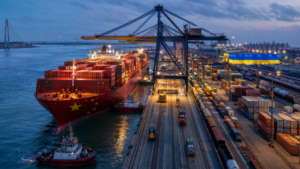
China maintained its top position by a wide margin among suppliers of goods to Ukraine in January–July 2026, accounting for $16.8 billion in imports, according to the Experts Club information and analytical center, based on data from the State Customs Service.
According to calculations based on State Customs Service statistics, China accounted for about 28.9% of Ukraine’s total goods imports, which reached $58.1 billion over the seven-month period.
Poland was the second-largest supplier with $5.5 billion, or about 9.5% of imports, while Germany ranked third with $3.8 billion, or 6.5%.
Thus, just three countries accounted for almost 45% of the value of all goods imported into Ukraine in January-July.
Total goods imports over the seven months increased by 26.6% compared with the same period of 2025, from $45.9 billion to $58.1 billion.
Machinery, equipment and vehicles remain the main factor behind the high level of imports, with purchases amounting to $25.7 billion. Fuel and energy products accounted for another $8.5 billion, while chemical industry products amounted to $8 billion.
At the same time, Ukraine’s exports over the same period grew significantly more slowly — by 3.8%, to $24.1 billion.