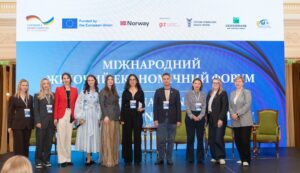
On April 30, 2026, Kyiv hosted the International Women’s Economic Forum 2026—a large-scale event that brought together women entrepreneurs, business leaders, representatives of international organizations, business associations, financial institutions, the public sector, and the expert community.
The forum served as a platform for substantive discussions on the role of women in Ukraine’s economy, the development of women’s entrepreneurship, business internationalization, Ukrainian companies’ entry into European Union markets, export readiness, access to financing, and new opportunities for scaling women-led SMEs.
The event was organized by the Ukrainian Chamber of Commerce and Industry in cooperation with the NGO “International Women’s Economic Forum” and UKRSIBBANK BNP Paribas Group, with the support of the STEP IN 2 EU international cooperation program, which is co-financed by the governments of Germany and Norway, as well as the European Union under the EU4Business initiative and implemented by the German federal company Deutsche Gesellschaft für Internationale Zusammenarbeit (GIZ) GmbH.
The forum was opened by Hennadiy Chyzhykov, President of the Ukrainian Chamber of Commerce and Industry, who emphasized that women’s entrepreneurship today is not only a socially important issue but also a significant economic resource for Ukraine’s recovery, export development, and enhanced competitiveness.
“Among Ukrainian exporters, there are still half as many women as men. Not because they can’t do it. But because conditions have long been unfavorable. I am happy to see the community of women entrepreneurs growing. I am happy to see more and more businesses and institutions getting involved in creating opportunities for the development of women’s leadership,” noted Hennadiy Chyzhykov.
Olena Kondratiuk, Vice Speaker of the Verkhovna Rada of Ukraine; Tetiana Anishchuk, Deputy Head of the STEP IN 2 EU Program at GIZ Ukraine; and Nataliia Kolomatska, Deputy Chair of the Management Board and Chief Operating Officer of UKRSIBBANK BNP Paribas Group, also addressed the forum participants and guests with welcoming remarks.
In her speech, Olena Kondratiuk emphasized that Ukrainian women are already a powerful force for the country’s economic resilience. She stressed that women not only start new businesses but also take responsibility for jobs, communities, families, export opportunities, and the future of the Ukrainian economy.
“The strength of Ukrainian women is not an abstraction. It is the ability to quickly adapt to new conditions and keep the economy afloat,” emphasized Olena Kondratyuk.
Separately, during the forum, it was highlighted that women’s entrepreneurship in Ukraine is growing even amid the war. Women are increasingly establishing new companies, entering international markets, engaging in export activities, and developing manufacturing, social enterprises, service businesses, creative industries, technological solutions, and high-value-added products.
The forum’s program was structured around several key thematic blocks. The first panel discussion focused on the role of women’s business associations, chambers, clubs, and international networks in supporting female entrepreneurs. Participants noted that the development of women’s businesses requires not only individual grant or training programs, but a sustainable support infrastructure: access to knowledge, mentorship, partnerships, markets, financial instruments, and international contacts.
Particular attention was paid to how Ukrainian women’s business organizations can strengthen one another, develop a shared agenda, engage with international partners, and become the voice of women entrepreneurs in dialogue with the government, donors, financial institutions, and European business networks.
The second panel focused on programs supporting women’s entrepreneurship implemented by international organizations, donor programs, and development partners. The discussion covered opportunities for Ukrainian companies in the areas of training, consulting, grant support, export preparation, entering EU markets, digitalization, sustainable development, and enhancing the competitiveness of small and medium-sized businesses.
Representatives of international partners emphasized that support for women entrepreneurs must be practical, long-term, and tied to real business needs. The discussion focused not only on general issues of women’s leadership but also on specific tools: how to prepare a company for export, how to assess readiness for the international market, how to adapt a product to EU requirements, and how to navigate regulatory barriers, certification, logistics, financing, and partnership channels.
The third panel discussion was dedicated to the practical experiences of women entrepreneurs: exporting, scaling up, and entering European Union markets. Participants shared their own stories of growth, mistakes, challenges, and solutions that helped them expand beyond the Ukrainian market. Key topics included adapting business models, building trust with foreign partners, participating in international exhibitions, brand development, working with distributors, securing financing, and building the reputation of Ukrainian products abroad.
The panelists emphasized that Ukrainian businesses today export not only goods or services but also a new quality of entrepreneurial thinking: flexibility, speed of decision-making, the ability to operate under conditions of uncertainty, responsibility, and high internal motivation. It is precisely these traits that make Ukrainian companies competitive in international markets.
A separate focus of the forum was the topic of the event’s practical follow-up. The International Women’s Economic Forum 2026 is not viewed as a one-time event. Its goal is to become a platform for systematic support of women entrepreneurs who seek to scale their businesses, enter foreign markets, and strengthen their export capacity.
As part of the follow-up work after the forum, 15 women entrepreneurs will be selected to receive individual consultations on business internationalization, export readiness, entering EU markets, regulatory compliance, developing an international strategy, and practical steps for scaling up. This format will allow the forum’s discussions to be transformed into concrete roadmaps for the development of Ukrainian women-led SMEs.
Overall, the forum brought together the entrepreneurial, expert, international, and institutional communities around a common goal—to make women in the Ukrainian economy more visible, stronger, better represented in international trade, and more integrated into European and global value chains.
The 2026 International Women’s Economic Forum demonstrated that Ukrainian women are already one of the key drivers of the country’s economic resilience. They are starting businesses, opening new markets, representing Ukraine abroad, supporting teams, investing in community development, and shaping a new culture of entrepreneurship—one that is bold, responsible, and open to the world.
And that is precisely why the forum’s main message rang out particularly clearly: make way for the bold.
Interfax-Ukraine – information partner.
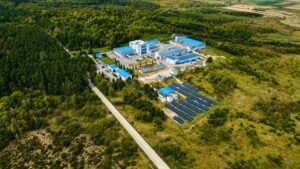
The Ukrainian group of companies Kormotech, a manufacturer of dog and cat food, continues to expand its on-site solar power generation at its production facility in Prylbychi, Lviv Region. The commissioning of a 366-kW ground-mounted solar power plant is scheduled for May, according to the company’s press service.
“The experience of leading European manufacturers confirms that on-site solar power generation at industrial facilities is becoming the industry standard. Kormotech is moving purposefully in this direction; our strategic goal by 2028 is to cover at least 15% of our electricity consumption through our own generation,” said Chief Power Engineer Yuriy Komprychevsky.
As previously reported, on July 2, 2024, Kormotech commissioned a 383 kW rooftop solar power plant. On June 6, 2025, the plant was modernized, after which its capacity increased to 442 kW. This made it possible to increase the volume of green electricity production.
At the same time, Kormotech’s energy team was seeking an external investor to build a ground-mounted solar power plant. Since May of last year, the company’s specialists have reviewed proposals from five companies. Following negotiations, Kormotech signed an agreement with Ecotech Invest. Under this model, the investor fully finances the construction of the plant, and the company purchases the generated electricity at a pre-agreed rate.
As of now, the company is completing the construction of a 366 kW ground-mounted solar power plant; after its launch, the total solar generation capacity at the Prilbychi facility will reach 808 kW.
According to Komprichevsky, on sunny summer days during lunchtime, the power plants will be able to cover up to 50% of the plant’s instantaneous consumption. On a monthly basis, the share of self-generated green electricity will account for about 13% of total consumption, and on an annual basis, about 8%.
Kormotech is an international family-owned company with Ukrainian roots, founded in 2003. It produces cat and dog food under the Optimeal, Club 4 Paws, Delickcious, Meow!, Woof!, and My Love brands. It has production facilities in Ukraine and the EU, and its product range includes over 650 items. The company’s products are available in 55 countries worldwide, both under its own brands and under the brands of partner companies.
According to published information, the company’s strategic goal is to become one of the top 30 global pet food manufacturers by 2029, with annual revenue of EUR 500 million, of which EUR 300 million is planned to come from European markets.

The private joint-stock company “Carlsberg Ukraine” will pay dividends totaling 50.20 million UAH, the company reported via the National Securities and Stock Market Commission’s disclosure system.
According to the report, the decision to allocate a portion of the net profit from 2025 operations to dividend payments was made by the company’s sole shareholder on May 4, 2026. The dividend per share is UAH 0.0491. The payment will be made in euros in a single installment between May 19 and November 4, 2026. The list of persons entitled to receive the funds will be compiled as of May 15, 2026.
In its 2025 management report, the company reported that it paid over UAH 3.20 billion in taxes and fees to budgets at all levels. Total investments in production, innovation, and safety since the start of the full-scale invasion exceeded UAH 2.70 billion.
Based on the results of the reporting year, Carlsberg Ukraine holds significant market shares in key segments: cider – 54.94%, non-alcoholic beer – 41.64%, kvass – 36.05%, and alcoholic beer – 30.05%. In the energy drink market, the company’s share was 5.62%. Export destinations included 25 countries worldwide, notably Moldova, Germany, the Czech Republic, Poland, and China.
Adapting the product range to new consumer trends was accompanied by the development of an agricultural project to research a new barley variety, Null-LOX4G, in collaboration with the National University of Life and Environmental Sciences of Ukraine (NULES), aimed at improving product quality while simultaneously reducing energy consumption and CO2 emissions. In addition, in 2025, the manufacturer launched a range of innovative products, including Battery energy drinks with peach lemonade flavor and the non-alcoholic “Kvas Taras Pryany.”
Meanwhile, on April 28, 2026 (Resolution No. 3/2026), the company’s sole shareholder granted preliminary consent to enter into significant transactions over the course of one year with a total aggregate value of up to UAH 79.60 billion. These funds will be allocated to support the company’s operational activities. The largest share, up to UAH 40.0 billion (264.64% of assets), is earmarked for contracts with retail chains and distributors for the sale and promotion of products. The shareholder has approved a significant amount of funds for the purchase of packaging materials: up to UAH 8.50 billion for aluminum cans and lids, up to UAH 3.60 billion for glass bottles, and up to UAH 3.0 billion for PET preforms. Up to UAH 4.0 billion is allocated for the purchase of raw materials and other containers.
The limits also include the option to place available funds in deposits in an amount of up to UAH 8.0 billion or the equivalent in foreign currency. UAH 3.0 billion has been allocated for each of the following categories: energy costs (gas, electricity), advertising activities, and license fees. Funding for the purchase of equipment, spare parts, and repair work has been approved in the amount of up to UAH 2.0 billion, while up to UAH 1.50 billion will be allocated for transportation and freight forwarding services.
According to data from Opendatabot, by the end of 2025, the company’s revenue decreased by 2.6% compared to 2024—to 12.167 billion UAH—while net profit fell by 17.1%—to 1.807 billion UAH. At the same time, the manufacturer’s assets grew by 9.2% to UAH 15.114 billion, while debt obligations decreased by 5.7% to UAH 4.82 billion.
As reported, in April 2026, Swedish company Carlsberg Sverige AB became the new owner of 100% of the voting shares of PJSC “Carlsberg Ukraine,” having acquired the stake previously held by Baltic Beverages Invest Aktiebolag as a result of a merger.
PrJSC “Carlsberg Ukraine” is part of the Carlsberg Group and owns three breweries in Zaporizhzhia, Kyiv, and Lviv. Its brand portfolio includes “Lvivske,” Carlsberg, Kronenbourg 1664, “Kvas Taras,” Somersby, Battery, and others.
Fixed-line operator “Ukrtelecom” increased its net revenue by 3.5% in 2025 compared to 2024—to 4.16 billion UAH, according to the company’s separate annual report.
According to the report, other operating income last year grew 1.6 times compared to 2024—to UAH 1.20 billion, while the company’s total revenue for the year amounted to UAH 5.40 billion, which is 5% more than the year before last.
It is noted that operating profit (EBITDA) in 2025 grew by nearly 29%—to 1.20 billion UAH—although the company reported a net loss of approximately 365 million UAH for the year, due to the revaluation of the fair value of long-term accounts receivable.
According to the report, Ukrtelecom laid 4,500 km of fiber-optic cable in 2025, including in frontline settlements. The total length of the fiber-optic network reached nearly 93,000 km, serving 3.4 million households.
The number of connections to the fiber-optic network is growing across all segments, and the share of fiber-optic internet users exceeded 80% of the company’s total subscriber base of internet users, the document states.
It is noted that revenue from the provision of fiber-optic internet services for 2025 increased by 12%, and the NPS of Ukrtelecom’s new B2C fiber-optic customers as of the end of 2025 stands at nearly 75%.
In addition, as part of the “Optical Infrastructure Zone” (OIZ) program, a total of 70,700 Homepasses were built in 2025.
Reportedly, starting January 1, 2026, the company introduced a new speed standard for households connected to the GPON network nationwide—up to 1 Gbps. Thus, subscribers gained the ability to use gigabit internet regardless of their current tariff plan and “by default.”
It is noted that in 2025, Ukrtelecom paid nearly UAH 1.6 billion in taxes and fees to budgets at all levels, which is 17% more than in 2024.
The company’s assets as of the end of the year amounted to 13.82 billion UAH, which is 0.80 billion UAH more than at the beginning of the year.
The company also reported that current and long-term liabilities and provisions for 2025 decreased by 408 million UAH, while the volume of capital investments fell by 11% to 462 million UAH.
Among other significant events of the past year, the fixed-line operator highlighted the fact that it became the first Ukrainian company to join Connect Europe, an association of leading European electronic communications operators.
As for the main plans, these include scaling and modernizing the telecommunications network, building new modern fiber-optic networks, and modernizing the existing telecom network.
Other plans include the development of related and additional business areas, which include a partnership with YASNO: lead generation for solar power plant (SPP) installation projects, sales of “Smart Watt” and E-Mobility equipment, sales and leasing of IPv4 addresses, as well as the development of business processes and IT systems.
On May 4, PJSC Ukrnafta announced a tender for liability insurance for members of the supervisory board and executive body, as reported in the Prozorro system. The estimated cost of the services is UAH 6.880 million.
Documents will be accepted until May 15, 2026.
As previously reported, the winner of a similar tender in October of last year was IC “Universalna.”
JSC “Ukrnafta” is Ukraine’s largest oil producer and operates the country’s largest national network of gas stations—UKRNAFTA. In 2024, the company entered into an asset management agreement with Glusco. In 2025, it finalized a deal with Shell Overseas Investments BV to purchase the Shell network in Ukraine. In total, it operates nearly 700 gas stations.
The company is implementing a comprehensive program to resume operations and modernize the format of gas stations in its network. Since February 2023, it has been issuing its own fuel vouchers and “NAFTACard” cards, which are sold to legal entities and individuals through Ukrnafta-Postach LLC.
The largest shareholder of Ukrnafta is Naftogaz of Ukraine, holding a 50%+1 share stake.
In November 2022, the Supreme Commander-in-Chief of the Armed Forces of Ukraine decided to transfer to the state the share of corporate rights in the company that belonged to private owners, which is now managed by the Ministry of Defense.
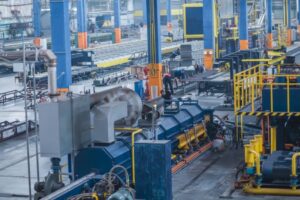
PJSC “Dniprovsky Plant ”Alumash,” a manufacturer of aluminum profiles, intends to allocate UAH 10 million of its net profit for 2025 to dividends.
According to information submitted by the company to the NSSMC’s disclosure system, this matter has been added to the agenda of the annual general meeting of shareholders scheduled for June 9 of this year.
It is proposed to distribute the profit earned from the company’s financial and operational activities in 2025, amounting to UAH 13,730,408, as follows: dividend fund – UAH 10,132,000, which constitutes 72.84% of the company’s profit earned in 2025. To retain UAH 3,729,088 in profit (27.16% of the profit earned).
It is also proposed to approve the conclusions of the audit report by the audit firm Garant-Audit LLC, draw conclusions, and approve measures based on the results of the review of the audit report.
The draft resolutions, copies of which are available at the Interfax-Ukraine agency, propose paying dividends to the company’s shareholders at a rate of UAH 6,440 per ordinary registered share of the private joint-stock company. Approve the resolution on the payment of dividends for 2025 in the total amount of UAH 10 million. The dividend payment period begins on July 1 and ends on December 8, 2026, inclusive. Dividends will be paid directly to shareholders.
PJSC “Dniprovsky Plant ”Alumash” was registered in July 1997. It manufactures aluminum profiles using Italian equipment, including general-purpose profiles and TECNO building profile systems under license from the Italian company S.L.L. SPA.
According to data from the National Securities and Stock Market Commission (NSSMC) for the fourth quarter of 2024, the company’s CEO, Oleksandr Danchenko, owns 6.5035% of the company’s shares; his father, Oleg Danchenko, owns 28.3323%; Mykhailo Senektutov holds 19.253%, Ivan Sosnovsky holds 14.295%, and Igor Levin holds 14.231%.
At the same time, the company’s 2024 report lists four individuals (without disclosing their full names) as major shareholders, holding stakes of 34.836%, 19.253%, 14.295%, and 14.231%, respectively.
The authorized capital of the private joint-stock company is UAH 19.95 million.