
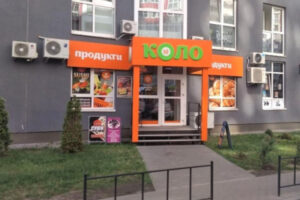
The Antimonopoly Committee of Ukraine (AMCU) has approved the acquisition by Omega LLC—which operates the Varus supermarket chain—of Ariteil LLC, the “KOLO” grocery store chain owned by Gennadiy Butkevych, a co-owner of the ATB Corporation.
The approval was granted on Thursday, July 16, according to the agency’s website.
“This deal will be one of the largest in the Ukrainian retail market in 2026. The merger will significantly strengthen the company’s position in the convenience retail segment. The combination of Varus’s extensive expertise and KOLO’s many years of experience in the ‘neighborhood store’ format will create a solid foundation for further business expansion,” reads a statement from Varus on Facebook.
According to information on the KOLO website, the chain currently operates more than 250 stores in Kyiv, the Kyiv region, and Odesa. The first “KOLO” store opened in Kyiv in 2017.
According to the YouControl analytical system, the owner of Ariteil LLC is JSC “ZNVKIF ‘Magnitar’,” with Hennadiy Butkevych listed as the ultimate beneficiary.
In 2025, Ariteil LLC’s revenue grew by 23% compared to the previous year, reaching 3.2 billion UAH. The net loss increased to 124.9 million UAH. At the end of the year, the company’s total assets amounted to 1.1 billion UAH.
Varus is a national supermarket chain represented in Ukraine’s grocery retail market by the company “Omega.” The first store opened in 2003 in Dnipro. Currently, there are 119 supermarkets in various cities across Ukraine.
The chain operates in several formats: traditional supermarkets, To Go stores, and the Varus.ua online store.
Omega LLC is owned by the Cypriot company “Vegant Enterprises Limited,” with Valery Kiptik and Ruslan Shostak as the ultimate beneficiaries.
As of the end of 2025, Omega LLC increased its revenue by 20% compared to the previous year, to 24 billion UAH, while net profit rose by 37.8%, to 41.4 million UAH.
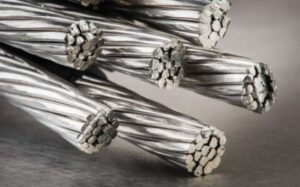
In January–June 2026, Ukraine increased its imports of nickel and nickel products by 5.2% compared to the same period last year, reaching $11,119 million.
According to customs statistics, nickel and nickel product imports in June totaled $1.946 million.
Exports of nickel and nickel products in January–June 2026 totaled $310,000, and in June—$118,000, compared to $608,000 for the first six months of 2025.
As previously reported, Ukraine reduced its imports of nickel and nickel products by 2.7% in 2025 compared to 2024, down to $26,011 million. Exports of nickel and nickel products totaled $1,420 million, compared to $602 thousand in 2024.
Nickel is used in the production of stainless steel and for nickel plating. It is also used in battery manufacturing, powder metallurgy, and chemical reagents.
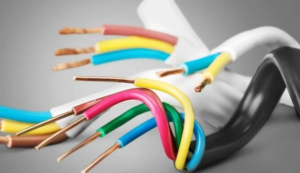
The value of Ukraine’s exports of insulated wires and cables (including fiber-optic cables) in January–June 2026 increased by 2% compared to the same period in 2025, reaching $741.2 million.
According to statistics from the State Customs Service (SCS), Germany remained the largest importer of Ukrainian products, as it was last year; shipments to Germany decreased by 3% to $245.3 million, and its share of total exports of these products fell by 1.7 percentage points to 33%.
As in the first half of last year, the top three importers also included Hungary—$124.8 million (last year: $118.1 million)—and Poland—$121.8 million ($111.3 million).
According to statistics, exports of these products in June fell by 3% compared to June 2025 but rose by 3.3% compared to May of this year, reaching $128.3 million.
At the same time, according to the State Customs Service, imports of wires and cables into Ukraine increased by 24.5% in the first half of the year, reaching $354.2 million.
The largest suppliers of wires and cables to Ukraine were China ($101.6 million), Hungary ($87.8 million), and Poland ($47.3 million), whereas last year imports from Hungary totaled $78.9 million, from China – $55.6 million, and from Poland – $41.1 million.
As previously reported, according to the State Customs Service, in 2025 Ukraine increased its exports of insulated wires and cables by 10.6% compared to 2024—to $1.41 billion—and imports by 24.3%—to $590.7 million.
Forecast of unemployment rate in Ukraine according to methodology of International labor organization until 2025
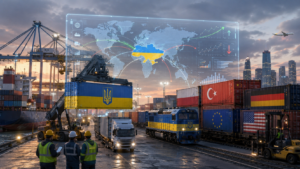
Ukraine’s total trade turnover with its 50 largest trading partners in January–June 2026 amounted to approximately $66.97 billion, according to calculations by the Experts Club information and analytical centre based on foreign trade in goods data. Imports from the countries included in the top 50 reached $47.35 billion, while Ukrainian exports amounted to $19.62 billion. The trade deficit stood at $27.73 billion. Thus, imports accounted for approximately 70.7% of trade turnover with Ukraine’s main partners, while exports accounted for only 29.3%. The export-to-import coverage ratio was 41.4%, meaning that for every dollar of Ukrainian goods sold abroad, there were approximately $2.41 worth of imports.
These indicators do not characterise Ukraine’s entire foreign trade, but rather its most concentrated segment—transactions with its 50 leading partners. At the same time, it is precisely this group that determines the main geographical and structural trends in Ukraine’s trade in goods. The ratio between imports and exports indicates that the economy continues to generate significant demand for foreign industrial, technological and consumer products, while the ability of Ukrainian manufacturers to offset these purchases with export revenues remains limited. This model is partly explained by wartime needs, the reconstruction of damaged infrastructure and imports of energy equipment, vehicles, machinery, electronics and components. However, the scale of the gap also points to insufficient export diversification and a high dependence on several traditional commodity groups.
“The concentration of more than half of trade turnover in five countries makes foreign trade sensitive to changes in market conditions, logistics and trade policies in individual markets. Dependence on Chinese imports remains particularly noticeable: China accounts for more than one-fifth of turnover with the TOP 50 partners, but the share of Ukrainian exports in this direction is comparatively small,” emphasised Maksym Urakin, founder of the Experts Club information and analytical centre.
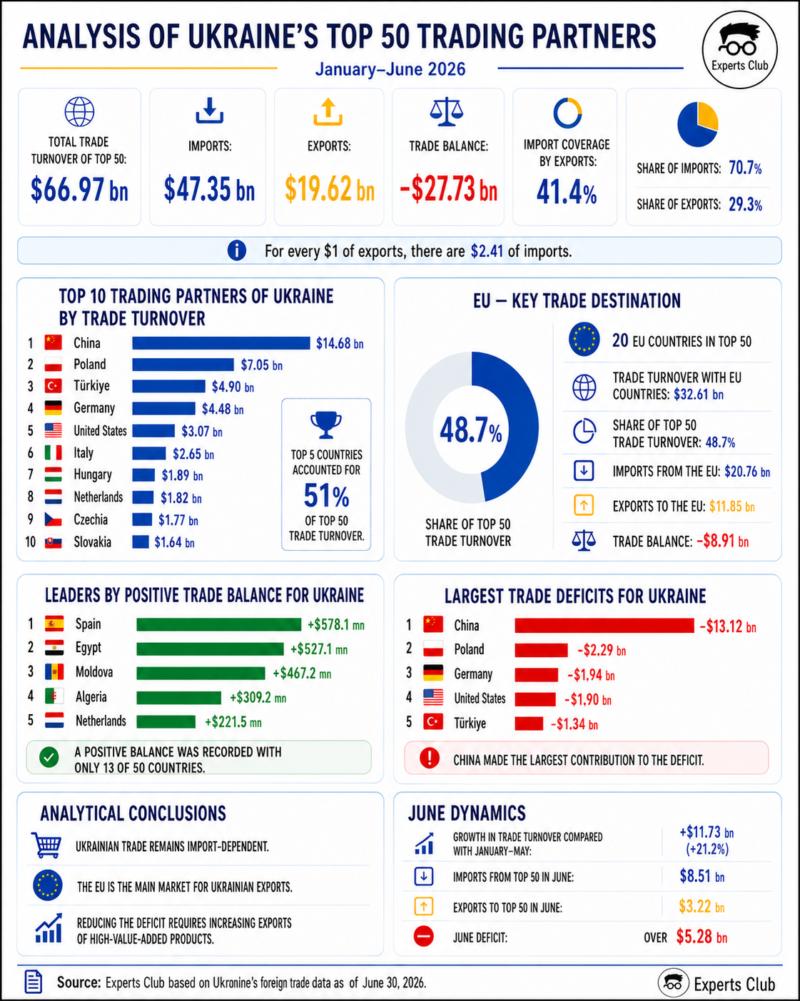
Compared with the results for January–May, cumulative trade turnover with the TOP 50 partners increased by $11.73 billion, or 21.2%. In June alone, imports from this group of countries amounted to approximately $8.51 billion, while exports reached $3.22 billion. Thus, in just one month, the trade deficit increased by a further $5.28 billion. Imports grew somewhat faster than exports in June: after the addition of the monthly data, their cumulative volume increased by 21.9%, while exports rose by 19.7%. This means that the expansion of foreign trade turnover occurred mainly due to purchases of goods abroad rather than a proportional strengthening of the positions of Ukrainian suppliers in foreign markets.
China retained its status as Ukraine’s largest trading partner by a significant margin. In the first half of the year, trade turnover with China reached $14.68 billion, of which $13.9 billion accounted for imports of Chinese goods and only $778.4 million for Ukrainian exports. The deficit amounted to $13.12 billion. China accounted for 21.9% of Ukraine’s total turnover with the TOP 50 partners and 29.4% of imports from this group of countries. At the same time, trade with China generated approximately 47.3% of Ukraine’s total trade deficit with the top 50. This imbalance demonstrates that China is primarily a source of goods, equipment and components for Ukraine, while Ukraine’s export presence in the Chinese market remains comparatively weak.
Poland ranked second with trade turnover of $7.05 billion. Ukraine imported $4.67 billion worth of Polish products and exported $2.38 billion worth, resulting in a deficit of $2.29 billion. Despite the negative balance, trade with Poland is more balanced than trade with China, while Poland has also become the largest individual market for Ukrainian exports. Türkiye ranked third with turnover of $4.9 billion, purchasing $1.78 billion worth of Ukrainian goods and supplying Ukraine with products worth $3.12 billion. Germany ranked fourth with $4.48 billion, while the United States ranked fifth with $3.07 billion. Total trade turnover with these five countries amounted to $34.18 billion, or 51% of turnover with the TOP 50. They accounted for 57.8% of imports but only 34.6% of Ukrainian exports, once again highlighting the concentration of purchases among several major suppliers.
“More than half of Ukraine’s trade turnover with its main partners is accounted for by just five countries, and this concentration is much more pronounced in imports than in exports. Trade with China is the most illustrative example: it accounts for almost one-third of imports from the TOP 50 but less than 4% of Ukrainian exports to this group of countries. This structure creates a long-term need not simply to reduce imports, but to develop domestic production and create new competitive export offerings,” emphasised Maksym Urakin, founder of the Experts Club information and analytical centre.
Italy, which ranked sixth, had one of the most balanced indicators among Ukraine’s leading partners. With trade turnover of $2.65 billion, imports from Italy amounted to $1.37 billion, while Ukrainian exports reached $1.28 billion, meaning that the deficit did not exceed $91.1 million. Hungary followed with turnover of $1.89 billion, the Netherlands with $1.82 billion, the Czech Republic with $1.77 billion and Slovakia with $1.64 billion. Together, the top 10 accounted for $43.95 billion, or 65.6% of trade turnover with the TOP 50. The top 20 partners accounted for $55.81 billion, or 83.3%. Therefore, the remaining 30 countries in the ranking accounted for less than 17% of turnover, indicating a fairly narrow geographical base for Ukraine’s main trade flows.
A significant role of European Union member states remains an important feature of the ranking. The TOP 50 included 20 EU countries, with total trade turnover amounting to approximately $32.61 billion, or 48.7% of the total figure for the top 50. Imports from these countries reached $20.76 billion, while Ukrainian exports amounted to $11.85 billion. Thus, the European Union accounted for almost 44% of Ukraine’s imports and more than 60% of its exports within the TOP 50. This means that the EU remains the main market for Ukrainian goods and, at the same time, a key source of industrial and consumer products. The trade deficit with the EU countries included in the ranking amounted to approximately $8.91 billion, although the imbalance in this area was significantly smaller than in trade with China.
Geographically, trade with Europe performs several functions for Ukraine simultaneously. Poland, Germany, Italy, the Netherlands and Spain are major sales markets; Central European countries provide transit and production cooperation; while Western European countries remain important suppliers of technology, equipment, vehicles, pharmaceuticals and chemical products. At the same time, the persistence of substantial deficits with Poland, Germany, France, the Czech Republic, Hungary, Lithuania and Greece indicates that even within the trade area most closely integrated with Ukraine, import demand is still growing faster than the ability of Ukrainian companies to increase supplies.
Poland became the largest market for Ukrainian exports, with a figure of $2.38 billion. Türkiye ranked second, receiving goods worth $1.78 billion. It was followed by Italy with $1.28 billion, Germany with $1.27 billion, Spain with $1.09 billion and the Netherlands with $1.02 billion. Unlike imports, where China had an almost threefold advantage over Poland, Ukrainian exports were distributed more evenly among the leading markets. This reduces dependence on a single buyer, but at the same time indicates the absence of a large foreign market capable of providing Ukrainian producers with sales volumes comparable to the scale of Chinese supplies to Ukraine.
Ukraine recorded a trade surplus with only 13 of its 50 largest partners, while imports exceeded exports in relations with 37 countries. The largest surplus was generated in trade with Spain, amounting to $578.1 million. High positive figures were also recorded with Egypt at $527.1 million, Moldova at $467.2 million, Algeria at $309.2 million, the Netherlands at $221.5 million and Lebanon at $220.5 million. The surplus in trade with Libya amounted to $181.3 million and with Tunisia to $155.1 million. This geography demonstrates the importance to Ukrainian exports not only of the EU but also of the markets of North Africa, the Middle East and neighbouring Moldova, where Ukrainian goods in a number of cases hold stronger positions than imported products from the respective countries.
At the same time, the list of the largest deficits demonstrates a different model of trade dependence. In addition to China, a significant negative balance was recorded with Poland at $2.29 billion, Germany at $1.94 billion, the United States at $1.9 billion and Türkiye at $1.34 billion. The five largest partners accounted for more than 74% of the total trade deficit with the TOP 50. A notable negative balance was also recorded with Greece, the Czech Republic, Hungary, France, Lithuania, Sweden, Taiwan, Vietnam and Japan. Part of this deficit is associated with purchases of products that are either not manufactured in Ukraine or are produced in insufficient quantities, but its continued accumulation creates additional demand for foreign currency and increases the economy’s dependence on external financing.
A comparison with the results for January–May shows that the composition of the TOP 50 did not change in June: the same countries were included in the ranking, although their positions within the list were noticeably redistributed. Indonesia demonstrated the largest rise, moving from 43rd to 34th place. Its trade turnover increased by almost $145 million in June and reached $320.6 million in the first half of the year. The main factor behind the rise was Ukrainian exports, which increased by approximately $107.7 million in June alone. This made it possible to almost balance bilateral trade: imports amounted to $166.8 million and exports to $153.8 million.
Canada rose from 47th to 40th place, increasing its trade turnover to $220.1 million, while Saudi Arabia moved from 27th to 23rd place with a figure of $649.8 million. Saudi Arabia’s rise was mainly driven by increased supplies to Ukraine: imports from the country rose by approximately $133.2 million in June, while Ukrainian exports increased by $41.5 million. By contrast, Jordan fell from 41st to 47th place, Switzerland from 22nd to 27th, Tunisia from 37th to 41st and Libya from 39th to 42nd. Such movements do not necessarily indicate an absolute decline in trade: in most cases, they reflect the fact that turnover with other countries grew faster.
Serbia retained 33rd place among Ukraine’s trading partners. In the first half of the year, trade turnover between the countries reached $345.9 million, of which $243.2 million accounted for imports of Serbian products and $102.7 million for Ukrainian exports. Bilateral turnover amounted to approximately $55.8 million in June. Ukraine’s negative balance for the six-month period reached $140.5 million, but Serbia’s retention of its position in the middle of the fourth group of ten countries in the ranking indicates that it has already become a notable, although still unbalanced, trading partner of Ukraine in the Balkans.
“The trade deficit cannot be assessed exclusively as a negative indicator, since part of the imports supports the restoration of production, energy facilities and infrastructure. However, a situation in which exports cover only about 41% of imports requires a systematic response. Ukraine needs to increase not only the physical volume of supplies but also the share of high-value-added products, develop processing, mechanical engineering, the food industry and technology exports. Without this, growth in trade turnover will continue to be accompanied by an accelerated accumulation of the deficit,” Maksym Urakin noted.
Overall, the results of the first half of the year indicate that Ukraine’s foreign trade remains geographically concentrated, import-dependent and uneven across individual directions. China dominates as the largest supplier and the main source of the deficit; the European Union remains the primary market for Ukrainian exports; while Türkiye, Egypt, Moldova, the Balkan countries, North Africa and the Middle East form an important additional belt of trade relations. The rise of Indonesia, Canada and Saudi Arabia demonstrates that the structure of Ukraine’s partners can change rapidly even within a single month, particularly in the case of large consignments of raw materials, industrial goods or food products.
Further improvement of the trade balance will depend on Ukraine’s ability to address several tasks simultaneously: maintaining access to traditional European markets, expanding its presence in Asian, African and Middle Eastern countries, restoring production capacity and increasing the share of processed products in exports. Simply reducing imports during reconstruction could hinder economic recovery, so the key objective should not be administrative restrictions on purchases but the accelerated growth of competitive exports. It is the transition from a predominantly raw-material-based model to broader manufacturing specialisation that can gradually reduce the trade deficit and make foreign trade more resilient to price, logistical and geopolitical risks.

Imports of electric telephone or telegraph sets and videophones (HS Code 8517) into Ukraine in January–June 2026 increased by 83.6% compared to the same period in 2025—to nearly $1.23 billion, according to statistics from the State Customs Service.
According to the statistics, imports of these products in June alone rose nearly 2.2 times compared to June of last year—reaching $234.8 million.
The largest volume of these products in January–June was imported from China (50.7%, or $621 million); they were also imported from the United States ($155.3 million) and Vietnam ($108.7 million), whereas last year the top sources were China ($362.6 million), Vietnam ($103.5 million), and the United States ($56.3 million).
At the same time, exports of these products from Ukraine in the first half of the year totaled $62.5 million (in January–June 2025 — $60 million). Shipments were made primarily to Hungary (70.2%), Poland (18%), and Taiwan (8.4%). During the same period last year, these products were also exported primarily to Hungary (71.5%), as well as to Poland (23%) and Spain (1%).
According to the State Customs Service, as previously reported, in 2025, Ukraine imported telephone and telegraph equipment and videophones worth nearly $1.634 billion—29.5% more than in 2024—including $907.9 million worth from China.



