
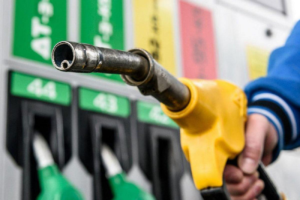
The cost of fuel and lubricants in Ukraine in July 2026 was 28% higher than a year earlier, while the average increase across the European Union amounted to 16.9%, according to an analysis by the Experts Club information and analytical centre based on data from Eurostat and the State Statistics Service of Ukraine.
Thus, the annual rate of fuel price growth in Ukraine was 11.1 percentage points higher than the EU average and approximately 1.66 times the European level.
Eurostat published data on fuel price dynamics on August 21, 2026. The statistics cover HICP category CP0722 — “fuels and lubricants for personal transport equipment,” which includes gasoline and diesel fuel, among other products.
Romania led the EU in fuel price growth
In July 2026, fuel and lubricants became more expensive year-on-year in 25 of the 27 EU member states.
Eurostat recorded the largest increases in:
Romania — by 24.2%;
Germany — by 22.9%;
Lithuania — by 22.9%;
Bulgaria — by 22.2%;
the Netherlands — by 22%;
Finland — by 20.5%.
All these figures significantly exceeded the EU average of 16.9%.
For comparison, the cost of fuel increased by 16.7% in Portugal, 12.5% in Italy, 9.9% in Cyprus, 3.2% in Ireland and 1.2% in Sweden.
Malta was the only country where prices remained unchanged. Eurostat explains this by the fact that retail fuel prices in the country have remained fixed since 2020.
In Hungary, the cost of fuel and lubricants decreased by 0.1%, making it the only EU member state with negative annual dynamics.
According to the State Statistics Service of Ukraine, fuel and lubricants in July 2026 were 28% more expensive than in July 2025.
Thus, if Ukraine were conditionally placed alongside EU countries solely based on the percentage change in fuel costs, it would rank above Romania, with its figure of 24.2%.
At the same time, Experts Club notes that such a comparison is indicative.
Eurostat calculates indicators for EU member states based on the Harmonised Index of Consumer Prices, or HICP, using a common European methodology. Ukraine’s figure of 28% was calculated by the State Statistics Service within the framework of the national consumer price index. Therefore, it would be incorrect to officially include Ukraine in the Eurostat ranking.
Nevertheless, the comparison makes it possible to assess the scale of the increase in fuel expenses for Ukrainian households and businesses.
The gap between fuel price dynamics and overall inflation in Ukraine is particularly noticeable.
Annual consumer inflation in the country amounted to 7.7% in July 2026, while fuel and lubricants rose in price by 28%.
In other words, fuel prices increased approximately 3.6 times faster than the overall consumer price index.
Since the beginning of 2026, fuel prices in Ukraine have increased by 26.5%. At the same time, a slight price decline of 0.1% was recorded in July compared with June.
The increase in fuel costs is already affecting transport expenses. Road passenger transportation in Ukraine was 30.8% more expensive in July than a year earlier, while transport services overall were 28.9% more expensive.
Following a decline in prices in June, the European fuel market returned to growth in July.
On average across the EU, diesel fuel rose in price by 4.3% over the month and gasoline by 4.7%.
Diesel prices increased most sharply in Poland, by 13.4% over the month, followed by Germany at 12.7% and Greece at 12.1%.
Poland led in gasoline price growth, with prices rising by as much as 17.2%. Gasoline became 11% more expensive in Germany and 7.1% more expensive in Spain.
At the same time, fuel prices declined in some countries. The price of diesel fell by 7.9% in Cyprus, 7.4% in Sweden and 6.4% in Ireland. Gasoline became 11.1% cheaper in Sweden, 5.4% cheaper in Cyprus and 4.1% cheaper in Ireland.
The dynamics of the European market remain unstable. In May 2026, fuel and lubricants in the EU were 20.7% more expensive than a year earlier. In June, the growth rate slowed to 13.7%, before accelerating again to 16.9% in July.
Experts Club analysts emphasise that the ranking reflects the rate of price change, rather than the absolute cost of a litre of gasoline or diesel fuel. Therefore, a country with a small percentage increase may continue to have significantly higher retail prices at filling stations than a country ranked among the leaders in terms of price dynamics.
Differences between countries are influenced by the level of excise duties and other taxes, retail pricing mechanisms, exchange rates in countries outside the euro area, the structure of oil refining and petroleum product imports, as well as the comparative base from the previous year.
The study was prepared by the Experts Club information and analytical centre based on statistics from Eurostat and the State Statistics Service of Ukraine.

The State Property Fund (SPF) of Ukraine has announced the privatization of the state-owned enterprise “Drohobych Salt Plant” for the second time, according to a Facebook post by the company’s director, Oleg Petrenko.
“The State Property Fund is announcing the privatization of our enterprise for the second time. As the head of the enterprise, I support privatization—it can bring new investments and growth to the enterprise. The main thing is that this process be conducted consistently and transparently, without backroom deals or haste that could be manipulated to serve someone’s interests,” he noted.
The company’s director noted that the Drohobych Salt Works is a profitable enterprise that has been operating for over 600 years, preserving the traditional method of salt boiling, and is one of the few such facilities in Europe.
“Drohobych salt has a future. And we believe that we can build that future without losing what we have already achieved,” Petrenko concluded.
The state-owned enterprise “Drohobych Saltworks” has been in operation since the 14th century and is one of the oldest continuously operating salt production facilities in Europe. The enterprise extracts natural brine and produces table salt using traditional technology. In 2024, the plant produced and sold 678.3 metric tons of salt.
According to Opendatabot, in 2025, the revenue of the Drohobych Salt Works State Enterprise grew by 40.3%—to 34.4 million UAH—and its net profit increased by 33.8%, to 849,200 UAH.
Drohobych, INVESTMENT, PRIVATIZATION, saltworks, STATE PROPERTY FUND

In July 2026, Ukraine’s steel mills produced 457,000 metric tons of steel, which is 21.3% less than in July of last year and 33.9% less than in June, when 691,000 metric tons were produced.
At the end of the month, Ukraine ranked 26th among 70 countries whose data is tracked by the World Steel Association (Worldsteel).
Overall, global steel production in July declined much less—by 0.3% year-over-year, to 149.2 million metric tons. Thus, the rate of decline in production in Ukraine significantly exceeded the global average. Worldsteel’s official data was published on August 24, 2026.
From January through July, Ukrainian steelmakers produced 4.023 million metric tons of steel, which is 5.6% less than during the same period in 2025. Based on the results of the first seven months, Ukraine ranks 24th in the global rankings.
The decline in July was particularly sharp compared to the previous month. While Ukrainian enterprises produced about 691,000 metric tons of steel in June, output fell by nearly 234,000 metric tons in July.
This also led to a decline in the country’s position in the global ranking: after seven months, Ukraine ranks 24th, while in July alone it dropped to 26th place.
By comparison, most of the largest producers increased their output in July. India increased production by 1.9%, the U.S. by 4.4%, South Korea by 6.4%, Turkey by 7%, Germany by 3%, and Vietnam by as much as 34.7%. China, on the other hand, reduced production by 3.6%. According to official data from Worldsteel, Russia increased its July production by 3.3%, to an estimated 5.7 million metric tons.
In the first seven months of 2026, global steel production totaled 1.081 billion metric tons, down 0.6% year-over-year. Ukraine, with a 5.6% decline, is also showing significantly weaker performance than the global market as a whole.
In 2025, Ukraine produced approximately 7.4 million metric tons of steel. According to World Steel’s latest annual table, the country ranked 23rd globally, down from 22nd in 2024.
The World Steel Association brings together leading steel producers, national and regional industry associations, and research organizations. The association’s members account for about 85% of global steel production.

Ukraine’s foreign exchange earnings from ferrous metal exports in July 2026 totaled $199.9 million, which is nearly 32% less than in June, when exports brought in $293.6 million, according to data from the State Customs Service.
Thus, July was noticeably weaker than the previous month for Ukrainian steel exports.
Overall, from January through July, companies in the sector earned $1.678 billion from ferrous metal exports, which is 7.6% less than during the same period last year.
At the same time, imports of ferrous metals in July totaled $176.4 million. The difference between exports and imports thus narrowed to approximately $23.5 million for the month.
Over the seven-month period, metal imports rose by 7.2% to $1.023 billion.
The decline in July’s export revenue comes after two years of recovery in metallurgical exports. In 2024, their value rose by 16.9%, and in 2025, by another 7.85%.
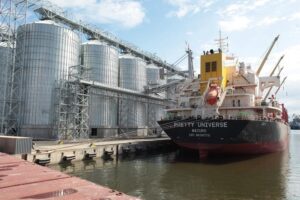
Ukraine’s agricultural exports in August 2026 are expected to total approximately 1.33 million metric tons, which is 54% less than in July and could mark the lowest August figure since the full-scale war began, according to brokerage firm Spike Brokers.
“Expected August exports will be 68% lower than the average August export volume for 2022–2025—4.19 million metric tons—and 64% lower than the previous August low during the full-scale war—3.71 million metric tons in 2025,” the company noted.
According to the brokers, 641,900 metric tons of agricultural products were exported via all modes of transport in the first half of August, compared to 2.889 million metric tons for the entire month of July.
The share of maritime transport in total exports fell from 86.5% in July to 51.4% in the first 15 days of August, while the share of rail transport rose from 11.2% to 38.5%.
At the same time, the increase in the share of rail transport does not indicate a resumption of grain shipments: grain exports by rail fell by 68% compared to July and by 77% compared to the same period last year.
So far in August, 250,000 metric tons have been shipped by rail through western border crossings, which is 126% more than in the corresponding period of July, while shipments to the ports of Greater Odesa totaled only 53,200 metric tons—a decrease of 94.5%.
“The increase in land-based shipments offset only about 15% of the loss in seaport traffic; even when combined with the increase in exports via Izmail, the offset does not exceed 19%,” the report states.
The volume of grain railcars transported through western border crossings during the first 18 days of August increased 2.3-fold—to 160.6 railcars per day, compared to 71.3 railcars in July. The Romanian route had the highest volume—49.1 cars per day, followed by Poland—47.9 cars, Slovakia—34.8 cars, and Hungary—28.8 cars.
As of August 19, there were 9,524 thousand railcars en route to the border, which is 21% more than at the end of July; specifically, the number of grain railcars rose to 979 from 369.
The Izmail route is also increasing its shipments, but cannot compensate for the loss of maritime exports: grain exports via Izmail rose from 10 thousand to 38.8 thousand metric tons, while shipments to the ports of Greater Odesa fell by more than 0.9 million metric tons.
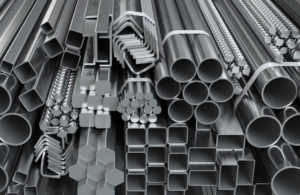
Ukraine’s positive foreign trade balance in ferrous metals decreased by approximately 24% in January–July 2026, to $655 million, according to Open4Business calculations based on data from the State Customs Service.
Over the seven months, Ukraine exported $1.678 billion worth of ferrous metals, while imports amounted to $1.023 billion.
During the same period of 2025, exports reached $1.816 billion, while imports, based on their current growth of 7.2%, amounted to approximately $954 million. Thus, the trade surplus at that time stood at approximately $862 million.
The reduction in the positive balance is associated with two trends: the export revenue of Ukrainian steelmakers decreased by 7.6%, while the value of products imported into the country increased by 7.2%.
In July, the gap between exports and imports narrowed even further: ferrous metal exports amounted to $199.9 million, while imports totalled $176.4 million.
Despite the deterioration in dynamics, Ukraine’s trade in ferrous metals remains in surplus. However, the margin of exports over imports is becoming significantly smaller.
Source: State Customs Service of Ukraine, Open4Business calculations.



