

According to Fixygen, the strategies of the largest public companies that have built up cryptocurrency reserves began to diverge significantly in September.
Strategy, the largest corporate holder of Bitcoin, has not purchased any BTC for the second week in a row. Instead, the company allocated approximately $139.3 million to repurchase its own STRC preferred shares.
As of September 13, Strategy held approximately 845.05 thousand BTC, purchased for a total of $63.73 billion. The average purchase price was about $75.4 thousand per Bitcoin.
In other words, the company temporarily redirected part of its free liquidity from Bitcoin accumulation toward managing its own capital structure.
For Strategy, the STRC buyback makes economic sense, as it allows the company to reduce future dividend obligations if the securities trade below their par value of $100. The company announced back in the summer that it intends to regularly repurchase STRC at a significant discount.
BitMine Immersion Technologies is pursuing a completely opposite strategy.
On September 14, the company reported that it had increased its reserves to 5.96 million ETH, which corresponds to approximately 4.9% of Ethereum’s total supply of 122 million tokens.
Over the course of the week, BitMine acquired an additional 27,000 ETH, bringing it closer to its goal of holding 5% of Ethereum’s supply.
The company estimates the total value of its crypto assets and cash reserves at approximately $15.8 billion.
The difference between the two models is becoming increasingly apparent. Strategy is effectively building a financial company centered on Bitcoin and managing a complex system of common stock, preferred securities, and debt capital.
BitMine, on the other hand, is trying to accumulate Ethereum as quickly as possible while simultaneously capitalizing on the opportunity to generate income from staking.
This divergence points to the next stage in the development of companies managing digital assets: the market is beginning to evaluate not only the quantity of accumulated coins, but also the method of financing, the cost of capital, the return on assets, and the risk of dilution for shareholders.
Direct funding for security and defense in Ukraine’s draft 2027 state budget amounts to approximately UAH 4.855 trillion, or 66.8% of all planned expenditures, reports the Experts Club information and analytical center.
Including UAH 30 billion in state guarantees, the government declares a total defense resource of UAH 4.885 trillion. Compared with the 2026 plan, this represents an increase of approximately UAH 517.8 billion, or 11.9%.
Most of the increase is allocated to military pay and salaries with related charges, which rise from UAH 1.454 trillion to UAH 1.792 trillion. Meanwhile, the comparable allocation for weapons and military equipment in the Finance Ministry’s presentation remains virtually unchanged at UAH 2.299 trillion, compared with UAH 2.297 trillion in 2026.
Civilian sectors will also receive nominal funding increases. Social spending rises to UAH 540.3 billion, education to UAH 328.5 billion, and healthcare to UAH 292.5 billion. However, part of these increases will be absorbed by projected average annual inflation of 8.6%.
The draft budget also relies on several tax measures that still require legislative approval. In particular, the calculations include an increase in the standard VAT rate from 20% to 21%, expected to generate an additional UAH 58.7 billion. Four proposed tax measures together are expected to raise UAH 117.3 billion.
The macroeconomic forecast assumes real GDP growth of 1.3% in 2027, average annual inflation of 8.6%, and an average exchange rate of UAH 47.1 per US dollar, compared with an expected UAH 44.4 in 2026. The year-end 2027 exchange rate is projected at UAH 48.3 per dollar.

According to Experts Club, the global oil market has entered a phase of a major fuel crisis following more than half a year of declining commercial stocks of crude oil and petroleum products, while the options for further drawing on strategic reserves are becoming increasingly limited, The Wall Street Journal reports, citing executives from the largest U.S. oil companies.
As the publication notes, U.S. oil companies have been warning for several months that prolonged restrictions on shipments through the Strait of Hormuz would ultimately lead to a fuel shortage. Now, according to their assessment, that moment has arrived.
Global commercial fuel stocks have been declining for more than six months. At the same time, governments have already been actively drawing on strategic reserves to keep prices in check, so the volume of available additional supply has dropped significantly. The WSJ emphasizes that this does not mean government reserves have physically run out, but rather that the scope for new large-scale interventions is becoming significantly narrower.
Chevron CEO Mike Wirth stated as early as September 11 that the reserves and other mechanisms that had kept oil prices from rising for several months “have largely run their course.” According to him, global commercial oil reserves were at high levels at the beginning of the year, but by September they had declined significantly.
The attack on the East-West oil pipeline in Saudi Arabia—which allows oil to be exported bypassing the Strait of Hormuz—dealt an additional blow to the market. Analysts estimate that after the pipeline was shut down, at least 2.5 million barrels of oil per day disappeared from the market.
The International Energy Agency (IEA) also confirms these supply issues. The agency describes the situation as the largest disruption to oil supplies in the history of the global market. Before the crisis, approximately 15 million barrels of crude oil and another 5 million barrels of petroleum products passed through the Strait of Hormuz daily, which together accounted for about 20% of global oil consumption.
To stabilize the market, IEA member countries agreed back in March to release 400 million barrels of oil from emergency reserves—the largest such release in the agency’s history. However, as the crisis drags on, this reserve mechanism is becoming less effective.
According to the latest available IEA data, from the start of the Middle East crisis through the end of July alone, global observed oil stocks fell by approximately 410 million barrels, or an average of 2.7 million barrels per day. Total stocks fell below 7.9 billion barrels for the first time since April 2025.
The situation is particularly tense in the diesel and jet fuel markets. The IEA notes a sharp decline in international shipments of petroleum products and a record increase in refining margins. Diesel exports from Russia, the Middle East, and Asia were approximately 1.3 million barrels per day lower than last year’s level, accounting for about one-fifth of global seaborne diesel trade.
An additional risk stems from China. In previous months, the country had cut imports and partially drawn down its own stockpiles, helping to curb global demand. However, by August, Chinese refineries were already processing more crude oil than was supplied by current imports and domestic production, prompting the country to draw down its stockpiles more aggressively.
Against this backdrop, Brent crude is once again trading above $100 per barrel. Following a new attack on Saudi infrastructure, Brent prices rose to approximately $107.5 per barrel on September 15, while WTI prices climbed above $103.
The IEA identifies the restoration of full-scale oil and petroleum product shipments through the Strait of Hormuz as the key factor capable of quickly stabilizing the market. Without this, the global economy will remain vulnerable to new disruptions, as a significant portion of the reserves that helped the world weather the first months of the crisis has already been depleted.
Source: The Wall Street Journal article “Oil Executives Say the Great Fuel Crisis Is Here” dated September 15, 2026.
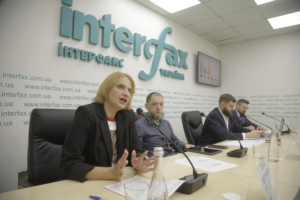
Canada ranked first in terms of the balance of positive and negative attitudes among Ukrainians among Ukraine’s 50 largest trading partners, while China, which leads in trade turnover, received the lowest indicator, and attitudes toward Poland deteriorated significantly, according to the results of a study by Active Group and the Experts Club information and analytical center.
According to the published ranking, the balance of positive and negative assessments of Canada amounted to plus 73.8 percentage points. It was followed by Sweden – plus 70.6 p.p., the Netherlands – 69.7 p.p., Finland and Norway – 69.3 p.p. each, France – 69.1 p.p., Italy – 67.1 p.p., Lithuania – 65.9 p.p., Switzerland and the United Kingdom – 65.6 p.p. each.
This indicator is the difference between the shares of positive and negative responses. In particular, 76.3% of respondents have a positive attitude toward Canada, 2.5% have a negative attitude, and 19.2% have a neutral attitude.
The worst balance was recorded for China – minus 25.4 p.p.: 18.2% of respondents assess it positively, 43.6% negatively, and 33.9% neutrally. India also has a negative indicator – minus 14.3 p.p., Hungary – minus 12.7 p.p., and Lebanon – minus 9.2 p.p.
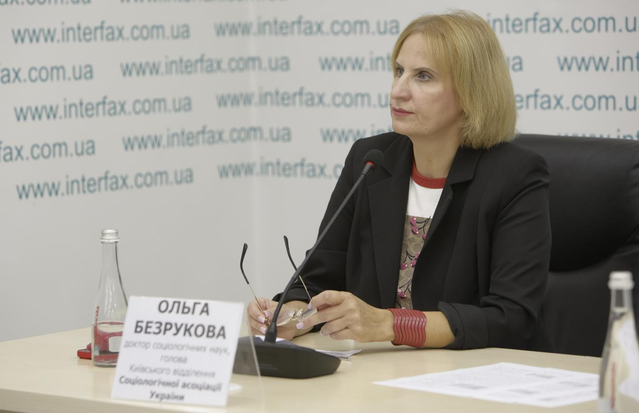
Doctor of Sociological Sciences and head of the Kyiv branch of the Sociological Association of Ukraine Olga Bezrukova called China an illustrative example of the gap between the scale of economic interaction and the country’s public image.
“We saw that China is Ukraine’s largest economic partner in terms of total trade turnover, but this is in no way converted into a positive public image. This shows that Ukrainian citizens clearly distinguish between the pragmatism of economic interaction and the overall assessment of a state. Economic dependence and interaction do not equal public sympathy for this country,” she emphasized at a press conference at the Interfax-Ukraine agency on Tuesday.
One of the most noticeable changes was the deterioration in attitudes toward Poland. While in March 2026 the balance of assessments stood at plus 41.7 p.p., in August positive and negative responses were practically equal, with a slight predominance of negative ones. A positive attitude was expressed by 34.6% of respondents, a negative one by 37%, and a neutral one by 25.4%.
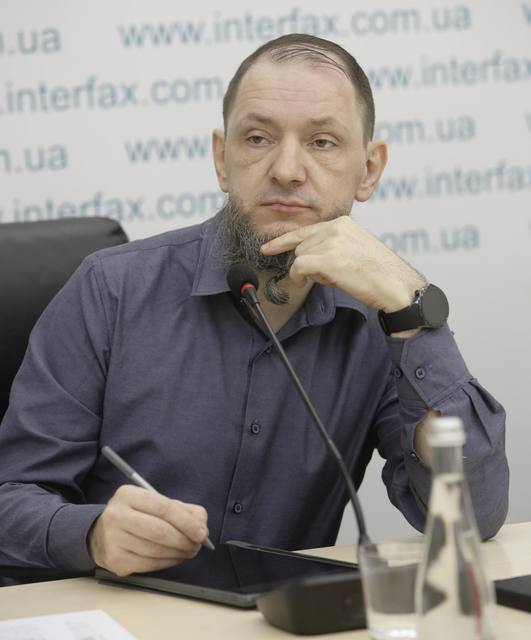
“At the beginning of the invasion, Poland was perceived almost as the main partner. We asked about the rapprochement between Ukraine and Poland, political and economic, even about uniting into some kind of common union, and we saw enormous positive results. But here we see: Poland seemingly still remains a key partner, but the idea of unification has already been forgotten, and we see stable negativity,” said Active Group founder Andriy Yeremenko.
He linked the deterioration in assessments to the position of part of the Polish authorities, which he considers anti-Ukrainian.
At the same time, the balance of attitudes toward Hungary improved from minus 33.6 p.p. in March to minus 12.7 p.p. in August, although negative assessments still prevail. For the United States, the indicator rose from plus 19.4 to plus 38.4 p.p. Some 55% of respondents have a positive attitude toward the United States, 16.6% a negative attitude, and 25.6% a neutral attitude.
When asked who contributes most to achieving peace in Ukraine, 44.6% of respondents named European Union countries, 25.2% the United States, 23.3% the United Kingdom, 4.1% China, 1.8% India, and 1% Brazil. Regarding priority development of trade and economic relations, 69.9% chose EU countries and the United Kingdom, 11.9% the United States, and 8.4% China.

According to Bezrukova, assessments of the U.S. role in achieving peace remained relatively stable throughout the three waves of the study.
“General sympathy toward a country and an assessment of its functionality at the international level are related but not identical things. Images of countries are multidimensional. A person may change their emotional attitude toward a state but continue to recognize its international weight,” the sociologist explained.
Another model, she said, is demonstrated by India: 48.3% of respondents express a neutral attitude toward it, but among formed assessments negative ones prevail – 31.5% versus 17.2% positive.
The economic indicators were presented by Experts Club founder, deputy director of the Interfax-Ukraine agency and PhD in Economics Maksym Urakin. According to State Customs Service data cited by him, in the first half of 2026 Ukraine’s trade turnover amounted to $70.3 billion, exports to $21 billion, and imports to $49.3 billion. The negative balance of trade in goods reached $28.3 billion.
“If we compare this with the first half of 2025, there was also an imbalance then, but now exports have increased by approximately 5%, while imports have risen by almost 30%. That is, the deficit increased by more than $10 billion over the year. Therefore, it is very important for us to analyze our main partners,” he emphasized.
According to the materials presented, trade turnover with China in January-June amounted to about $14.68 billion. Ukraine exported $778 million worth of goods to China and imported $13.90 billion, forming a deficit of approximately $13.12 billion. Poland remained the largest buyer of Ukrainian goods, with a volume of $2.38 billion. Türkiye ranked second among export markets with $1.78 billion, and Italy third with $1.28 billion.
In terms of total trade volume, China is followed by Poland – $7.05 billion, Türkiye – $4.90 billion, Germany – $4.48 billion, and the United States – $3.07 billion. Yeremenko highlighted Türkiye as an example of a combination of significant trade turnover and predominantly positive perception: 52.3% of respondents have a favorable attitude toward it, while 7.4% have a negative attitude.
Urakin separately drew attention to partners with which trade provides Ukraine with a positive balance. In the first half of the year, the largest was with Spain – $578.1 million, Egypt – $527.1 million, and Moldova – $467.2 million. They were followed by Algeria – $309.2 million, the Netherlands – $221.5 million, and Lebanon – $220.5 million. Libya, Tunisia, Iraq, and Yemen also entered the top ten.
At the same time, neutral attitudes prevail toward a number of these partners. Egypt is assessed neutrally by 61.3% of respondents, Algeria by 65.8%, and Tunisia by 67.3%. Participants in the press conference linked this to insufficient awareness among Ukrainians about these countries and emphasized the need for more active economic and public diplomacy.

“It is necessary to develop not only general awareness better. First of all, business associations, the Ministry of Economy and the Ministry of Foreign Affairs need to work to develop bilateral relations and improve the balance. In conditions where Ukraine already lacks financing and we live, essentially, at the expense of external borrowing, cooperation should be expanded with countries where we can have a positive balance,” said Active Group director Oleksandr Pozniy.
Urakin recommended that embassies accredited in Ukraine ensure full communication in the Ukrainian language, openness to the media, and regular reporting on the results of cooperation.
“The first recommendation is to regularly show concrete deeds, concrete actions, the presence here of foundations, embassies, teams, diplomats in the humanitarian sphere and in science. Second, to be open to questions and requests from the media and the public. We also need to use our sociology to draw conclusions and cement our relations, primarily trade relations,” he added.
This is the third wave of the study; the previous ones were conducted in August 2025 and March 2026. The survey was conducted in August 2026 using self-completed online questionnaires in the SunFlowerSociology panel. A total of 800 Ukrainian citizens aged 18 and over were surveyed. According to the organizers, the sample is representative by age, gender and region, and the stated maximum theoretical statistical margin of error at a 95% confidence level is 3.5%.
ACTIVE GROUP, CANADA, CHINA, EXPERTS CLUB, POLAND, PUBLIC OPINION, TRADE, UKRAINE, UNITED STATES

Production of corrugated cardboard boxes by Ukraine’s leading companies in the industry in August 2026 decreased by 11% compared to August of last year—to 46 million square meters, according to data from the “UkrPapier” association.
Compared to July of this year, corrugated packaging output decreased by approximately 8%.
The decline in finished packaging output was accompanied by a reduction in the production of raw materials for it. In August, companies produced 33,100 metric tons of packaging board, including paper for corrugation, which is 7.8% less than last year’s figure.
Total cardboard production amounted to 42 thousand metric tons, down 3.1% year-over-year.
August’s performance contrasts with last year’s results. By the end of 2025, Ukrainian companies had increased production of corrugated cardboard boxes by 2.1%—to 599.6 million square meters.
Corrugated packaging is widely used in the food industry, e-commerce, logistics, consumer goods manufacturing, and export shipments; therefore, its production volume serves as an indicator of activity across several economic sectors.
According to previously published data from the association, in the first seven months of 2026, corrugated packaging production also lagged behind last year’s level by approximately 2.7%. August significantly exacerbated this downward trend.
Under martial law, the “UkrPapier” Association does not publish individual production figures for each company.
Source: “UkrBumaga”.
CARDBOARD, CORRUGATED PACKAGING, PACKAGING, PRODUCTION, UKRAINE

On September 30, Kyiv will host the professional gathering “METRONOM. Kyiv,” dedicated to collaboration between developers and architects and the creation of added value in real estate projects. The event is organized by the DMNTR media group.
The meeting will take place from 4:00 PM to 10:00 PM at 2 Knyaziv Ostrozkykh Street, near the “Arsenalska” metro station.
“METRONOM. Kyiv” is designed for a professional audience of up to 200 participants, including investors, developers, architects, manufacturers of building materials, and representatives of the real estate market.
The business program will be centered around three practical case studies. Teams of developers and architects will present real-world projects entering the market and demonstrate how collaboration between the client and the architect is structured, which decisions influence a property’s value, and how the architectural concept is integrated into the development model.
Among the event’s headliners are representatives from A Development, AVG Group, and A. Pashenko Architects: Oleksiy Baranov, Yulia Polyukhovich, Andriy Pashenko, and Andriy Voitko.
The second case study will be presented by SAGA Development and BGV Development—Andriy Vavrysh, Anna Viken, Yevhen Binyavskyi, and Serhiy Zalevskyi.
The third case study will feature representatives from “Creator-Bud” and AIMM—Igor Guda, Maxim Myatko, Dmytro Struk, Yulia Dementyeva, and Lyudmila Chumak.
Registration for participants will begin at 4:00 p.m. The business session, featuring presentations of the three case studies, will run from 5:00 p.m. to 7:30 p.m. Following that, from 7:30 p.m. to 10:00 p.m., there will be an informal program featuring jazz, a buffet, and networking.
The organizers are offering three participation options. A standard ticket costs 2,500 UAH and includes participation in the business session, a cocktail reception, and networking.
A premium ticket, priced at 5,000 UAH, includes priority registration, seats in the premium section, an extended evening program featuring a buffet, a cigar ceremony, and a whiskey tasting, as well as a separate networking session.
Online participation costs 1,500 UAH and includes access to the live stream of the event’s business program from 5:00 PM to 7:30 PM.
Seating is limited. Participation in the event and access to the online stream are available only after prior registration and payment.
Registration: DMNTR Media Group, tel. 077 777 25 47, 044 461 91 28.
Registration and ticket purchase form.
Open4business – information partner
ARCHITECTURE, DEVELOPMENT, DMNTR, KYIV, REAL ESTATE, МЕТРОНОМ



