
According to Experts Club, electric vehicles in Ukraine will remain more cost-effective than internal combustion engine vehicles even after full taxation on their import is restored, says Serhiy Kuyun, director of the “A-95” Consulting Group.
According to Enkorr, a 20% VAT is set to be reinstated on electric vehicle imports into Ukraine starting January 1, 2027. Meanwhile, the preferential regime in effect until the end of 2026 exempts electric vehicles from VAT and import duties.
According to Kuyun’s assessment, the elimination of this exemption will make electric vehicles more expensive to purchase, but it will not deprive them of their main advantage—significantly lower operating costs.
“Even with all taxes included, an electric vehicle remains cost-effective. The electricity needed to charge it is significantly cheaper than fuel for a vehicle with an internal combustion engine,” the expert notes.
The savings on operating costs are particularly noticeable with high annual mileage. If an electric vehicle consumes about 15–20 kWh of electricity per 100 km, then when charged at home, the cost of such a trip remains several times lower than the cost of gasoline or diesel fuel for a vehicle of a similar class.
An additional advantage of electric vehicles is the simpler design of their powertrain. They lack a number of components and consumables typical of vehicles with internal combustion engines, which potentially reduces the cost of regular maintenance.
According to Kuyun, the Ukrainian market has already reached a stage of development where tax incentives are no longer the main driver of demand for electric vehicles. In recent years, the model lineup has expanded significantly, the used-car market has grown, and the charging station infrastructure is developing.
At the same time, the reinstatement of the VAT could have a noticeable impact on the market immediately before the end of the tax incentive period. Buyers planning to purchase an electric vehicle may try to import and register it by the end of 2026 to take advantage of the current tax incentives.
As a result, electric vehicle imports may accelerate further in the final months of 2026, after which the market may undergo a correction period in early 2027.
For comparison: with a customs value of 20,000 euros for an electric vehicle, the 20% VAT refund alone potentially increases the tax component by approximately 4,000 euros, without taking into account the specifics of determining the tax base and other payments. However, for an owner with high annual mileage, part of this difference is gradually offset by lower energy and maintenance costs.
Analysts at Experts Club note that the future dynamics of the Ukrainian electric vehicle market will no longer depend solely on tax incentives. The cost of electricity and automotive fuel, the development of charging infrastructure, prices for new and used electric vehicles, the condition of batteries, and the residual value of vehicles on the secondary market will become increasingly important.
Therefore, the reinstatement of full taxation may alter the structure of imports and slow the market’s growth rate; however, it does not, in and of itself, eliminate the economic advantages of electric vehicles for a significant portion of drivers.
Original source: Enkorr – “Electric Vehicles Will Remain Cost-Effective Even With All Taxes — Expert”.

The Czech oil and gas company MND is considering investing at least $60 million in hydrocarbon production projects in Ukraine as part of a partnership with the Naftogaz Group.
Naftogaz and MND signed a memorandum of understanding on potential cooperation regarding three existing production-sharing agreements between Ukrgazvydobuvannya and the Ukrainian government. The document was signed during the Carpathian Eight Summit, the group reported.
If the agreements are implemented, MND will be able to participate in the development of Ukrainian fields and contribute its own capital, technology, and operational expertise to the projects.
The initial investment under the three agreements could total $60 million. However, the Czech company’s participation has not yet been finalized—it will depend on the results of the relevant competitive selection process.
Naftogaz views attracting international oil and gas companies as one of the tools for increasing its own gas production amid regular Russian attacks on Ukraine’s energy infrastructure.
Serhiy Fedorenko, acting head of Naftogaz, noted that the group is interested in international partners capable of bringing investment, modern technologies, and practical experience.
In turn, Yana Gamrshmidova, CEO of the energy division at MND Group, stated that the company is already contributing to Ukraine’s energy resilience and intends to introduce new technologies and create jobs.
MND is of particular interest as a strategic investor because it is not a financial institution but an active European energy company with its own expertise in hydrocarbon exploration and production.
For Ukraine, attracting such a partner could mean not only an inflow of foreign capital but also access to field development technologies and management expertise from the European oil and gas industry.
The memorandum is not yet a final investment agreement. The parties must still agree on the terms of cooperation, and MND’s potential participation in production-sharing agreements must go through the procedures required by law.
However, the announced initial investment of $60 million makes the initiative one of the most significant new projects involving private European capital in Ukraine’s extractive industry.
China is ready to remain a reliable partner of Ukraine and to expand mutually beneficial cooperation between the two countries, said Ma Shenkun, Ambassador of the People’s Republic of China to Ukraine.
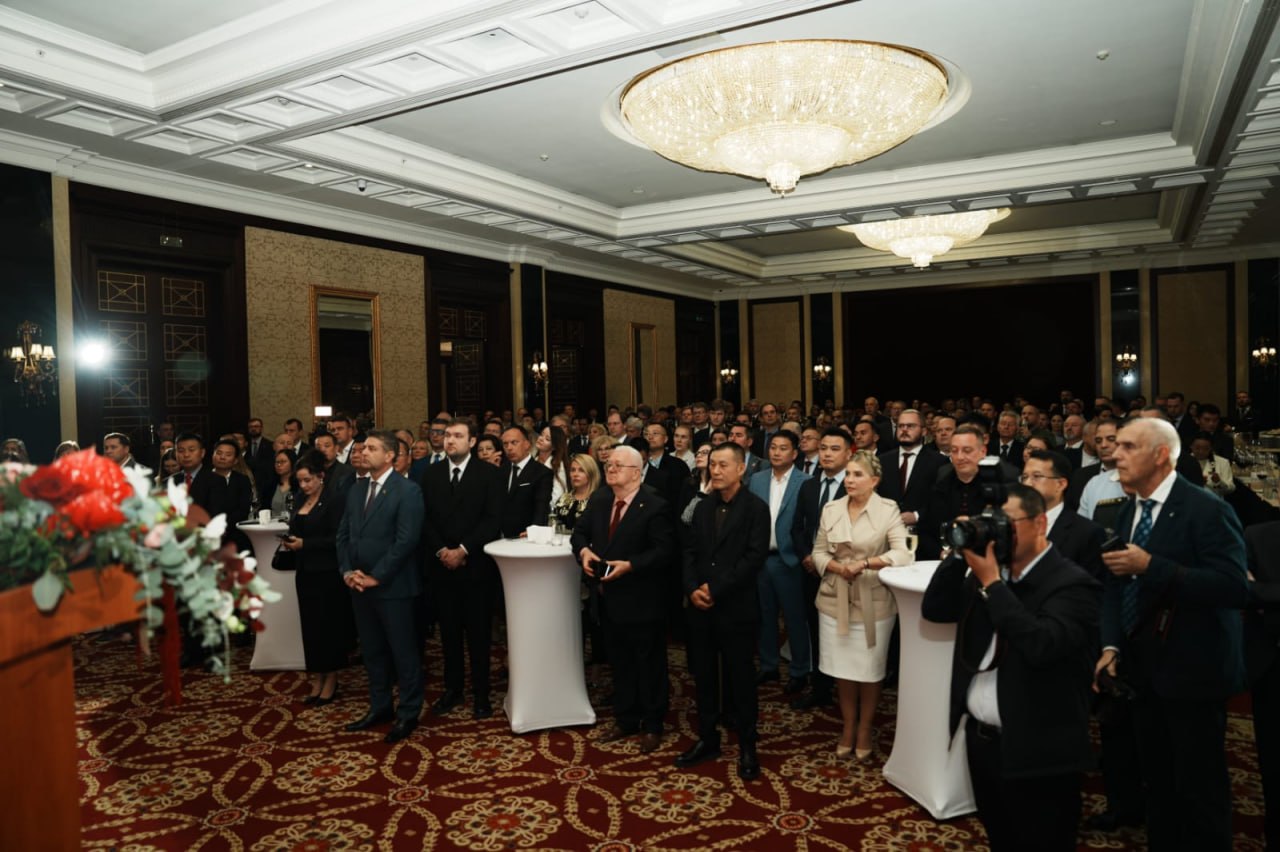
“The economies of China and Ukraine are highly complementary, so cooperation between the two countries has broad prospects. China is ready to be a reliable partner of Ukraine. We are committed to further expanding mutually beneficial cooperation, bringing greater benefits to the peoples of both countries, and jointly opening up new prospects for the development of China-Ukraine relations,” the ambassador said during a reception in Kyiv marking the 77th anniversary of the founding of the People’s Republic of China.
The event was attended by Ukraine’s Deputy Minister of Foreign Affairs Yevhen Perebyinis, as well as representatives of the diplomatic corps, Ukrainian government and civil society organizations, the business community, and the Chinese community.
Ma Shengkun noted that 2026 will mark the 15th anniversary of the establishment of the China-Ukraine strategic partnership, and in 2027, the two countries will celebrate the 35th anniversary of the establishment of diplomatic relations.
According to him, China has remained Ukraine’s largest trading partner for many years and is one of the main sources of Ukrainian imports.
The ambassador highlighted the development of bilateral trade in agricultural products. Specifically, in 2025, Ukraine and China signed protocols opening opportunities for the export of Ukrainian peas and wild-caught aquatic biological resources, and in 2026, they signed a protocol regarding the export of Ukrainian wheat flour to China.
“This creates a solid foundation for the further expansion of Ukrainian agricultural exports,” noted Ma Shenkun.
Speaking about the state of the Chinese economy, the diplomat reported that China’s GDP in the first half of 2026 reached 69.6 trillion yuan, an increase of 4.7% compared to the same period last year.
According to him, China intends to continue developing high-tech manufacturing, new energy, artificial intelligence, robotics, and innovative pharmaceuticals, while simultaneously opening its economy further to the outside world.
Ma Shengkun also addressed Beijing’s position on the war in Ukraine. He stated that China advocates for a political settlement and the continuation of diplomatic efforts.
“China will continue to stand firmly on the side of peace and support all efforts that promote peace. In turn, China will continue to play a constructive role in facilitating the swiftest possible ceasefire and cessation of hostilities and, ultimately, the achievement of a peace agreement,” the ambassador stated.
He noted that nearly two years of work in Ukraine have convinced him that the Ukrainian economy has significant potential for further development and cooperation with China.
A significant portion of the ambassador’s speech was devoted to the achievements of the PRC’s 77-year development. Ma Shengkun noted that China has become the world’s second-largest economy, a global leader in the volume of merchandise trade, and one of the main trading partners of more than 160 countries and regions.
The diplomat also stated Beijing’s intention to continue international cooperation within the framework of the “Belt and Road” initiative, which, he said, has been joined by over 150 countries and more than 30 international organizations, with the number of infrastructure and industrial projects currently underway exceeding 4,000.
According to a study by the Experts Club think tank, China ranked first among Ukraine’s largest trading partners in the first half of 2026. Trade between the countries totaled approximately $14.68 billion, including imports of Chinese goods to Ukraine of about $13.9 billion and Ukrainian exports to China of about $778 million. China accounted for about 21.9% of Ukraine’s total trade with its 50 largest trading partners and 29.4% of imports from this group of countries. At the same time, Ukraine’s trade deficit with China amounted to approximately $13.12 billion. Experts Club study on Ukraine’s largest trading partners in the first half of 2026
According to data from the State Customs Service, this trend continued in January–August 2026: China remained the largest supplier of goods to Ukraine, with imports totaling over $19.6 billion.
The People’s Republic of China recognized Ukraine’s independence on December 27, 1991, and diplomatic relations between the two countries were established on January 4, 1992. The Embassy of the People’s Republic of China in Kyiv began operations in 1992. That same year, the Embassy of Ukraine in Beijing began operations. In 2011, Ukraine and China established a strategic partnership.

Andriy Butenko, Ukraine’s Minister of Education and Science, discussed with Seymur Mardaliyev, the Ambassador of the Republic of Azerbaijan to Ukraine, the recognition of higher education documents, the expansion of cooperation between universities, and the preparation of bilateral events in the field of education and science.
“As of early 2026, more than 5,400 Azerbaijani citizens were studying in Ukraine—about one-third of all international students. The Ukrainian side reaffirmed its interest in maintaining this cooperation and creating appropriate conditions for pursuing an education,” according to a statement from the Ministry of Education.
It is noted that special attention was given to the recognition of diplomas from Ukrainian higher education institutions in Azerbaijan.
In particular, the Ukrainian side proposed to thoroughly examine the relevant issues within the framework of a specialized working group.
The meeting also addressed the issue of documentation required for the admission and arrival of Azerbaijani students coming to study in Ukraine.
In addition, the meeting participants discussed preparations for a visit to Azerbaijan by a delegation from the Ministry of Education led by Deputy Minister Mykola Trofimenko.
“The proposed program includes a working group meeting on the recognition of educational documents, as well as meetings with the leadership of the relevant ministry and university rectors. The visit is intended to facilitate the development of joint decisions and the establishment of direct partnerships between higher education institutions in both countries. The possibility of organizing a meeting between the education ministers of Ukraine and Azerbaijan by the end of this year was also discussed,” the statement reads.
The parties also discussed preparations for the 14th meeting of the Joint Intergovernmental Commission on Economic Cooperation and the signing of an intergovernmental agreement on scientific and technical cooperation.
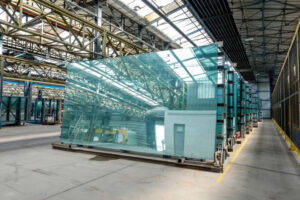
NovaSklo, a subsidiary of the Ukrainian investment group EFI Group, has moved on to the next practical phase of implementing the project for Ukraine’s first modern float glass plant, valued at approximately 250 million euros—the company has begun the selection process for a general contractor for the construction of the facility.
The tender was announced on September 18, 2026. NovaSklo is seeking a contractor capable of performing the full scope of construction work for a large industrial facility.
The project is being implemented in Velyka Dymerka, Kyiv Oblast, approximately 25 km from Kyiv. According to materials from the International Finance Corporation (IFC), the future plant is designed to produce approximately 800 metric tons of glass per day. The facility will manufacture clear, ultra-clear, and energy-efficient coated glass, as well as tempered glass.
The IFC is providing advisory support for the project in collaboration with Japan. The corporation estimates the project’s total cost at €250 million, with construction scheduled to begin in late 2026 and the plant set to begin operations in 2028.
The international component of the project extends beyond IFC’s financing and advisory services. NovaSklo’s technology partner is Pilkington Technology Management, a subsidiary of Japan’s NSG Group, one of the world’s largest manufacturers of architectural and automotive glass.
NSG specialists will support the project during the design, construction, and production line launch phases, including technology optimization, energy efficiency, and industrial safety systems.
Once it reaches its designed capacity, the plant is expected to create more than 300 jobs and become Ukraine’s first large-scale float glass production facility.
The economic impact of the project could extend far beyond the plant itself. Ukraine remains dependent on imported flat glass, while the reconstruction of housing, commercial real estate, and infrastructure in the coming years is expected to generate significant domestic demand.
The establishment of domestic production will make it possible to replace a portion of imports and create a local raw materials and processing supply chain for manufacturers of windows, facade systems, insulated glass units, and other building materials.
At the same time, NovaSklo is establishing an international supply chain even before the plant’s launch. In June 2026, NovaSklo Trade signed an exclusive agreement to distribute Pilkington architectural glass in Ukraine.
Thus, the project brings together Ukrainian industrial capital, the technology of Japan’s NSG Group, the expertise of the IFC, and support from Japan, and is one of the largest new industrial projects currently being prepared for construction in Ukraine.

Ferrexpo, a mining company with its main assets in Ukraine, reduced its capital expenditures (additions to property, plant, and equipment) by a factor of 2.1 in January–June of this year compared to the same period last year—to $13.892 million from $29.457 million.
According to Ferrexpo’s semi-annual report, additions to property, plant, and equipment totaled $63,755 million as of the end of 2025.
It is also noted that during the six-month period ended June 30, 2026, the net book value of disposals of property, plant, and equipment was $5,509 million (as of December 31, 2025 – $181,000; as of June 30, 2025 – $1,218 million). The total amount of depreciation accrued for this period was $12.951 million (as of December 31, 2025—$65.802 million; as of June 30, 2025—$34.418 million).
Assets under construction include capital projects in progress totaling $196.039 million (December 31, 2025 – $197.838 million; June 30, 2025 – $188.150 million) and capitalized costs for surface development work performed prior to the start of production, amounting to $29,280 million (December 31, 2025 – $31,223 million; June 30, 2025 – $31,712 million), relating to portions of ore bodies expected to be brought into operation only in future periods.
In addition, it is clarified that once ore production begins, capitalized stripping costs are reclassified as mining assets, and depreciation begins to accrue.
The carrying value of property, plant, and equipment includes capitalized borrowing costs related to qualifying assets totaling $18.349 million (as of December 31, 2025 – $21.4 million; as of June 30, 2025 – $23.826 million). During the period ended June 30, 2026, or the comparative periods, no borrowing costs were capitalized.
The report explains that the Group’s impairment testing of assets is based on cash flow projections for the remaining estimated useful lives of the Horishneplavnynske-Lavrykivske and Yeristivske fields, which, according to current approved mining plans, are scheduled to end in 2058 and 2048, respectively.
According to the report, the group’s long-term financial model is continuously updated. This process takes into account current operating conditions, which depend to a significant extent on the stability of the power supply, energy prices, the availability of logistics networks, as well as other potential negative factors caused by the war. Due to current restrictions, the production capacity used to forecast cash flows under the base-case scenario is expected to amount to approximately 32% of the pre-war level in fiscal year 2026, rising to about 63% in 2027 and returning to pre-war levels in the second half of 2028.
Regarding key assumptions, the cash flow forecast for the next five years is based on an average index price for iron ore (65% iron content) of $115 per metric ton on a CFR (Northern China) basis. In assessing the expected long-term sales price, the Group takes into account the results of external and internal analyses of supply and demand dynamics in the international market for iron ore pellets and concentrate in the short and long term, as well as specific local supply and demand indicators affecting the Group’s major customers. Due to growing demand for high-quality concentrate and the expected margin calculated based on projected market conditions, the share of concentrate production in the current long-term model has increased significantly.
At the same time, the Group is expected to adjust the mix of iron ore products in its production plan in accordance with future market conditions and taking into account the operational situation in Ukraine at that time. The Group’s main cost items, in particular production and transportation costs, are determined taking into account local inflationary pressures, the dynamics of the hryvnia-to-U.S. dollar exchange rate, short- and long-term trends in energy supply and demand, as well as expected changes in the prices of raw materials related to steel production, which could significantly affect the cost of certain production materials. Regarding the logistics route through Ukraine’s
Black Sea ports, which is currently inaccessible, given the importance of this route both for the parties to the conflict and for global grain shipments, management believes that the situation will improve in 2027, and therefore expects that Ukraine’s Black Sea ports will once again become accessible to the Group for the purpose of selling to certain markets.
Given the increase in the share of concentrate production in the current long-term model, management analyzed whether this might indicate that the assets used to produce pellets and concentrate constitute two separate cash-generating units (CGUs). After a thorough analysis, management concluded that it remains appropriate to test the
Group’s non-current operating assets as a single CGU, given the high level of vertical integration of production at the Group’s main subsidiary—Poltava Mining and Processing Plant—and the absence of largely independent cash flows.
It is also reported that the Group conducts transactions on market terms with entities under the common control of Kostyantyn Zhevago and his related parties. Such transactions are considered part of the Group’s ordinary course of business. During 2025, the group posted a bond in the amount of 5 million UAH (or approximately $120,000) on behalf of a senior executive of one of the group’s subsidiaries in Ukraine. The bail payment was related to court and other legal proceedings initiated by certain government agencies against the Group’s subsidiaries and senior management representatives in Ukraine. In March 2026, the court overturned the bail order, after which the funds were returned to the subsidiary. No such payments were made during the first six months of 2026.
The Group has virtually no debt obligations: as of June 30, 2026, it had a net cash position of $21 million (compared to $47 million as of December 31, 2025). Excluding lease obligations totaling $10 million (December 31, 2025: $11 million), the Group had no outstanding interest-bearing loans or credits as of June 30, 2026, and December 31, 2025.
As of June 30, 2026, Ferrexpo’s long-term corporate credit rating and debt rating, as assigned by Moody’s, was Caa3 with a “negative” outlook. At the Group’s request, Fitch and S&P no longer provide ratings.
As previously reported, Ferrexpo ended the first half of 2026 with a net loss of $14.9 million, which is 13.2 times less than the figure for the first half of 2025; revenue fell 2.3 times to $196 million. The company reduced capital expenditures (CapEx) to $10 million from $28 million in January–June 2025, allocating 88% of these expenditures to projects necessary to maintain operations and only 12% to development projects.
Ferrexpo owns a 100% stake in Yeristivskyi Mining and Processing Plant LLC, 99.9% of Bilanivskyi Mining and Processing Plant LLC, and 100% of the shares in Poltava Mining and Processing Plant PJSC.
FERREXPO, INVESTMENT, IRON ORE, MINING AND PROCESSING PLANT, UKRAINE



