
In 2026, Gas Distribution Networks of Ukraine LLC connected 140 distributed generation facilities, with plans to connect another 86 by the end of the year, according to Lyudmila Kinder, the company’s chairwoman.
“Distributed gas generation is currently one of the areas where demand for grid connection is growing particularly rapidly. This year, 140 such facilities have already been completed, and another 86 are scheduled for completion. Each project involves an assessment of the grid’s capacity, design, construction, connection, and gas commissioning,” she wrote on Facebook on Tuesday.
Kinder also noted that connecting businesses to the grid should be a “straightforward process,” which is what “Gazmereti” is currently working on.
“If a company has several facilities in different regions, it should not have to coordinate separately with each branch every time. We need to see the entire project portfolio and agree in advance on technical requirements, the workflow, and the order of implementation,” Kinder said, outlining her vision for building effective cooperation with businesses.
As previously reported, according to First Deputy Prime Minister for Energy Denys Shmyhal, Ukraine already has 1.8 GW of distributed gas-fired generation in operation.
On October 26, Kyiv will host the 12th Kyiv International Economic Forum (KIEF). More than 500 participants are expected—owners and executives of Ukrainian and international companies, government officials, investors, diplomats, and experts. The main theme of this year’s forum is “People. Business. Economy. What’s Next?”. Discussions will focus on how business and the economy can weather the new conditions, adapt, and return to growth.
In the fifth year of full-scale war, pressure on the Ukrainian economy is intensifying. Manufacturing, the energy sector, ports, railways, logistics centers, and other business-critical infrastructure are under attack. According to estimates by the Ministry of Economy, direct losses from destruction could reach about $10 billion annually, and combined with the blockade of seaports, they have already cost Ukraine about 1.5 percentage points of GDP in 2026. According to the World Bank’s October forecast, Ukraine’s economic growth will slow to 1.2% in 2026 and reach 1.5% in 2027 if active hostilities continue. In previous forecasts for 2027, the bank projected 4% growth, assuming hostilities would end by the end of 2026.
“While the discussion used to center on Ukraine’s recovery, the focus has now shifted to ensuring the economy’s resilience right now. Businesses need solutions that will help them protect their assets, maintain production, and continue investing even amid the war,” notes Vasyl Khmelnytskyi, initiator of the Kyiv International Economic Forum (KIEF) and founder of the UFuture holding company.
The KIEF 2026 program features 12 panel discussions. The discussions will center on the physical protection of businesses, operations during air raid alerts, decentralized logistics and energy supply, communication resilience, insurance against war risks, compensation for lost assets, access to financing, and maintaining macroeconomic stability. Other key topics include adapting the state’s industrial development strategy and energy policy to new conditions, the state’s economic priorities, international cooperation, and European integration in the face of new challenges. Special attention will be given to the experiences of frontline cities and the solutions already in place there.
Speakers at the forum include:
The Ukrainian economy already has experience adapting quickly during a crisis. In 2022, following the destruction of the Kremenchuk Oil Refinery and a fuel shortage, the country restructured its fuel logistics, and thousands of businesses relocated from frontline regions to the interior of the country. Following the blockade of traditional maritime routes in 2023, the Ukrainian maritime corridor became operational, and after last year’s large-scale attacks on the power grid, businesses and the government began actively developing distributed generation.
“Today, any discussion about the future must begin with finding practical solutions that businesses, the government, and international partners can adopt right now to maintain stability and return the economy to growth. That is exactly what this year’s KIEF is all about,” says KIEF CEO Yuriy Pivovarov.
Title partners of the forum: UFuture, Mastercard, AEQUO, PrivatBank, Kyivstar
Forum partners: Sense Bank, NEQSOL Holding, PUMB, DTEK, Ajax Systems, Uklon, TERWIN, Eclectic Talents Group, BALEX, CEO Club Ukraine.
Interfax-Ukraine and Open4Business are the forum’s media partners.
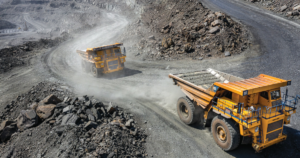
In January–September of this year, Ukraine’s mining companies reduced exports of iron ore raw materials (IORM) by 29.8% in volume terms compared to the same period last year—down to 16,948,958 metric tons from 24,145,038 metric tons.
According to statistics released by the State Customs Service (SCS), 1,174,008 thousand metric tons of iron ore were exported in September, 1,865,697 thousand metric tons in August, 1,875,428 thousand metric tons in July, in June—2,021,299 metric tons; in May—2,239,167 metric tons of raw materials; in April—2,163,837 metric tons; in March—2,300,467 metric tons; in February – 1,254,516 thousand metric tons, in January – 2,054,539 thousand metric tons.
Over the first nine months of 2026, foreign exchange earnings from mineral ore exports decreased by 29% to $1,286,304 million.
In addition, Ukraine imported 246 metric tons of raw materials worth $74,000 in January–September 2026, whereas in January–September 2025, it imported 107,000 metric tons worth $80,000.
As previously reported, Ukraine’s mining companies reduced ore exports in physical terms by 8% in 2025 compared to the previous year—to 30,995,363 metric tons from 33,699,722 metric tons, and foreign exchange earnings decreased by 16.6%—to $2 billion 337.765 million from $2 billion 803.223 million. Exports were primarily shipped to China (44.98% of shipments in monetary terms), Slovakia (17.15%), and Poland (16.09%).
In addition, in 2025, Ukraine imported $95,000 worth of raw materials totaling 130 metric tons from the Netherlands (46.32%), Italy (36.84%), and Norway (13.68%), whereas in the previous year it imported 2,042 metric tons worth $414,000
EXPORTS, IRON ORE, METALLURGY, mining and metallurgical complex, UKRAINE

The Italian Med-Or Foundation and the Hennadiy Udovenko Diplomatic Academy of Ukraine under the Ministry of Foreign Affairs of Ukraine have signed a memorandum of understanding aimed at developing cooperation in the field of diplomatic training and international dialogue.
According to reports, the document was signed on October 13 at Med-Or’s headquarters in Rome by the foundation’s president, Marco Minniti, and the director of the Diplomatic Academy of Ukraine, Ihor Ostash.
The agreement provides a foundation for joint initiatives in the field of diplomatic education, as well as expanded opportunities for cooperation between Italy and Ukraine. In particular, the agreement envisages the involvement of Italian and international instructors and experts in the Ukrainian academy’s educational programs.
The Med-Or Foundation already has experience in developing international partnerships in the field of personnel training in Africa and the Middle East.
The signing ceremony was also attended by Alfredo Mantovano, State Secretary to the President of the Council of Ministers of Italy and Security Commissioner of the Republic, and Ihor Brusylo, Ukraine’s Ambassador to Italy.
Med-Or noted that the agreement is part of the foundation’s broader program of activities aimed at developing international cooperation amid a complex international situation.
The signing of the memorandum lays the groundwork for further deepening Ukrainian-Italian ties in the areas of diplomatic education, the exchange of expert knowledge, and the training of specialists in international relations.
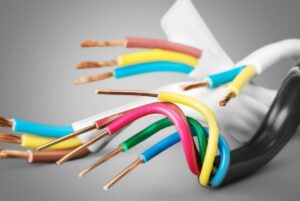
The Ukrainian insulated wire and cable manufacturing sector continues to be one of the industrial segments with a significant trade surplus.
In January–September 2026, Ukraine exported these products worth $1.065 billion, while imports totaled $540.7 million. Thus, the trade surplus reached approximately $524.3 million.
Exports exceeded imports by nearly two to one, which stands in stark contrast to the overall structure of Ukraine’s foreign trade, where imports of goods have significantly exceeded exports in recent years.
However, the trend indicates a gradual narrowing of this surplus.
Exports of wires and cables over the nine-month period remained virtually unchanged compared to last year, while imports rose by 22.7%. According to estimates, imports in January–September 2025 totaled about $441 million, and the trade surplus was approximately $624 million.
Thus, over the year, the trade surplus in wires and cables decreased by approximately $100 million, or 16%.
The European Union remains Ukraine’s main export market. Germany, Poland, and Hungary alone purchased nearly $698 million worth of Ukrainian products, accounting for about two-thirds of total exports.
At the same time, the structure of imports is becoming more Asian-oriented. China increased its shipments by approximately 70%—to $157 million—and took first place among suppliers, ahead of Hungary and Poland.
As a result, a dual trend is emerging: Ukraine continues to be a major supplier of cable products to European industry, but at the same time is rapidly increasing its purchases of certain types of wires, cables, and electrical components from abroad.
By the end of 2025, exports of cable products totaled $1.41 billion, while imports amounted to $590.7 million, meaning the annual surplus exceeded $819 million.
The sustained significant trade surplus makes the production of wires and cables one of the most interesting examples of the Ukrainian manufacturing industry, which is deeply integrated into European production chains. That said, future trends will depend on the state of the European automotive industry, energy infrastructure development, and the ability of Ukrainian companies to maintain production amid the war.
Source: State Customs Service of Ukraine, foreign trade statistics for January–September 2026.
State Customs Service Statistics
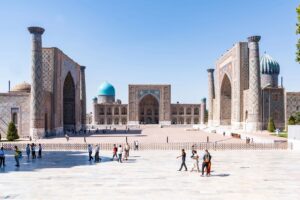
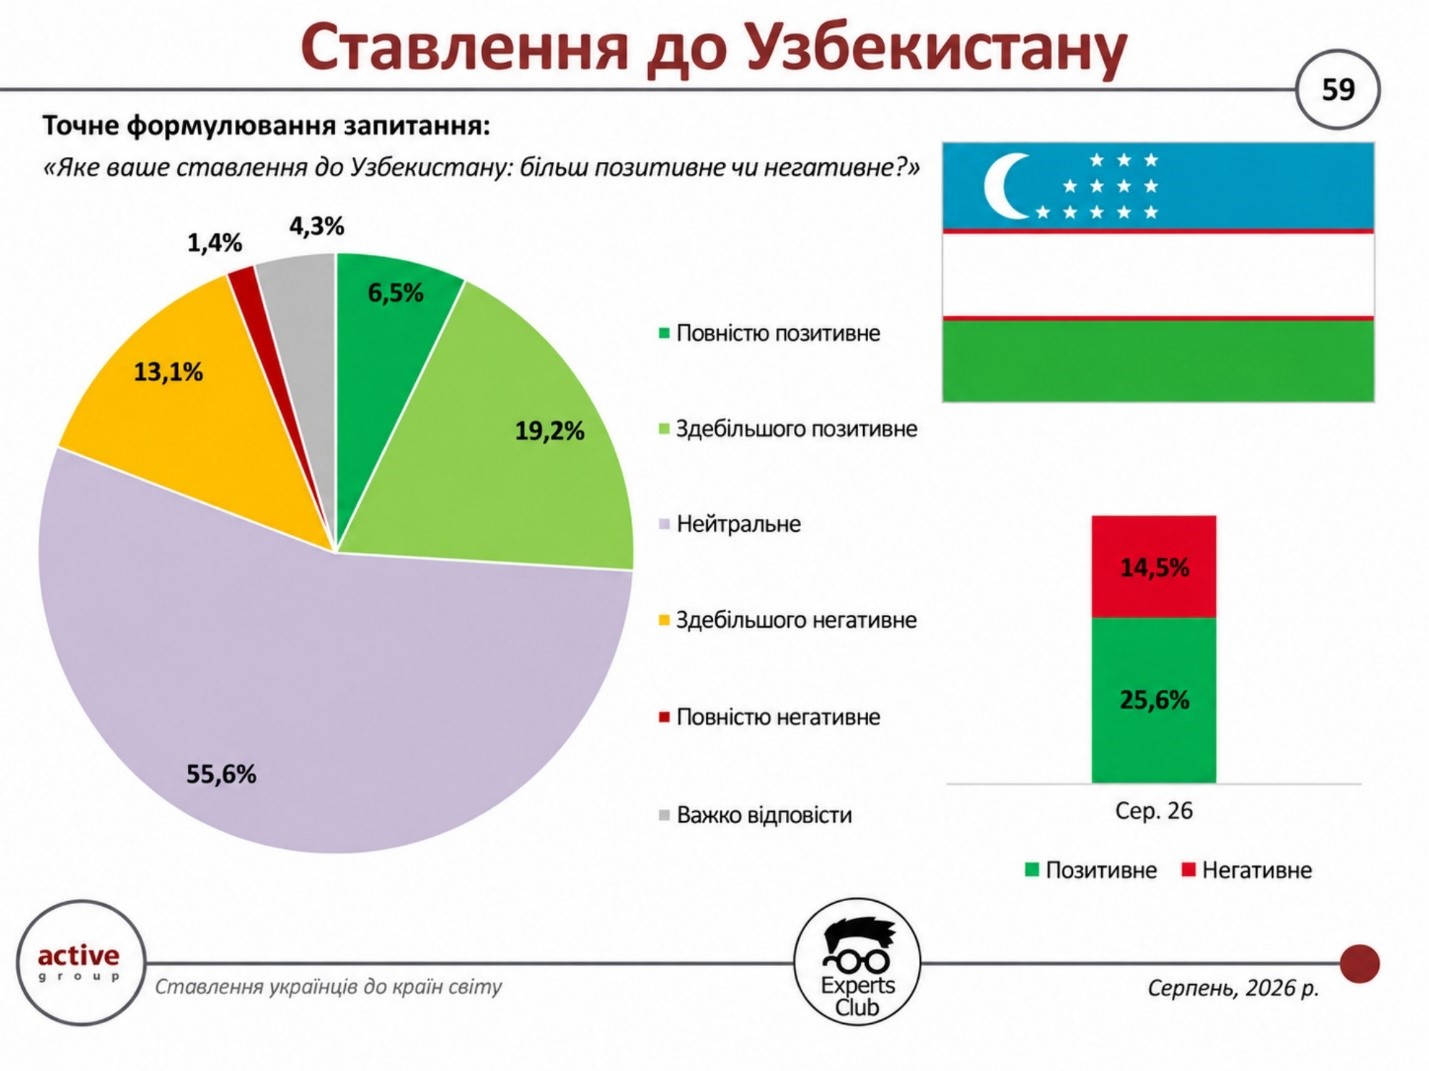
In August 2026, Ukrainians’ attitudes toward Uzbekistan remain predominantly neutral: 55.6% of respondents hold this view. Taking these categories together, 25.7% of those surveyed view the country positively, while 14.5% view it negatively, according to the Experts Club Information and Analytical Center. In the summary report, the positive figure is listed as 25.6%, which is due to the rounding of the raw data.
6.5% of Ukrainians have a completely positive attitude toward Uzbekistan, while 19.2% have a mostly positive attitude. 55.6% of respondents chose a neutral response. 13.1% view the country mostly negatively, 1.4% completely negatively, and another 4.3% were undecided.
When the categories are combined, the balance between positive and negative attitudes is +11.2 percentage points. Positive assessments thus outnumber negative ones by approximately 1.8 times. At the same time, more than half of those surveyed do not express a strong positive or negative stance toward the country.
In the overall regional picture, Uzbekistan has a less pronounced positive image than Georgia and Azerbaijan. In August, positive assessments stood at 57.3% for Georgia and 48.7% for Azerbaijan, while a high proportion of neutral responses remains the key feature of perceptions toward Uzbekistan.
At the same time, compared to the April 2025 survey, attitudes have become more defined. At that time, 63.4% of Ukrainians held a neutral stance toward Uzbekistan, 21.7% had a positive view, 9.3% had a negative view, and 5.6% were undecided. Thus, the positive segment grew by approximately 4 percentage points, the negative segment by 5.2 percentage points, and the share of neutral responses decreased by 7.8 percentage points.
Maksym Urakin, founder of the Experts Club Information and Analytical Center and a candidate of economic sciences, believes that a key factor in how Uzbekistan is perceived remains Ukrainians’ lack of awareness about the country’s current role in Central Asia.
“For a significant portion of Ukrainian society, Uzbekistan remains a rather distant country. People are exposed to far less information about its economy, business, politics, or humanitarian ties than they are about EU countries, the Caucasus, or Ukraine’s immediate neighbors. That is precisely why the neutral group still accounts for more than half of the respondents,” Urakin noted.
At the same time, he said, the decline in the share of neutral responses—from 63.4% in April 2025 to 55.6% in August 2026—is a more significant signal than the individual increase in positive or negative assessments.
“We are seeing the gradual formation of a more defined image of Uzbekistan. Some respondents are shifting from a neutral stance to a specific assessment of the country. At the same time, positive attitudes still significantly outweigh negative ones. This means that there is a sufficiently favorable foundation for the development of economic, educational, cultural, and humanitarian ties, but the image of Uzbekistan in Ukraine still requires a greater informational presence,” Urakin added.
The current results partially confirm this assessment: the neutral group remains the largest, but it has shrunk significantly compared to 2025. The simultaneous increase in both positive and negative responses indicates, above all, the gradual formation of a more defined attitude toward Uzbekistan.
The survey was conducted in August 2026 using an online self-administered questionnaire via the SunFlowerSociology panel among 800 Ukrainian citizens aged 18 and older. The sample is representative by age, gender, and region; the maximum theoretical margin of error for indicators at the 50% confidence level is ±3.5 percentage points.
ACTIVE GROUP, Central Asia, EXPERTS CLUB, international relations, PUBLIC OPINION, SOCIOLOGY, UKRAINE, URAKIN, UZBEKISTAN



