

Monthly and quarterly statistical data released after the end of the reporting period were used for the indicators. Maksym Urakin, Director of Development and Marketing at Interfax-Ukraine, PhD in Economics, and founder of the Experts Club information and analytical center, presented an overview of the current macroeconomic trends that shaped the situation in Ukraine and the world in May–June 2026.
Macroeconomic Indicators of Ukraine
As of the end of May, the Ukrainian economy maintained macrofinancial manageability, although the balance of risks remained unfavorable. Compared with April, headline consumer inflation slowed somewhat, but underlying price pressure intensified, while fuel prices continued to rise rapidly. International reserves declined for the fourth consecutive month, the merchandise trade deficit widened to $23 billion, and the budget continued to operate under an extremely high defense burden. At the same time, the NBU maintained control over the foreign exchange market, while international financing supported the government’s civilian expenditures.
According to the preliminary estimate of the State Statistics Service, released after the end of the reporting period, Ukraine’s real GDP decreased by 0.6% in Q1 2026 compared with Q1 2025. Compared with the previous quarter and adjusted for seasonal factors, the decline amounted to 0.7%. Nominal GDP stood at UAH 2,047.2 billion. The negative dynamics reflected the consequences of electricity shortages, the destruction of energy and logistics infrastructure, weak investment activity, unstable external financing, and unfavorable conditions at the beginning of the year. At the same time, domestic consumption, trade, certain segments of the processing industry, and the services sector partially restrained a deeper decline.
In its April macroeconomic forecast, the National Bank downgraded its estimate for Ukraine’s real GDP growth in 2026 to 1.3%. The regulator expected economic activity to be supported by consumer demand, budget expenditures, investment in the restoration of the energy sector and logistics, as well as the development of the defense-industrial complex. At the same time, the NBU forecast did not envisage a rapid transition to sustainable recovery due to security risks, damage to production capacity, labor shortages, and limited export opportunities.
“The May data confirmed that the Ukrainian economy is not yet in a phase of full-fledged recovery but is operating in a mode of difficult stabilization. The 0.6% decline in GDP in the first quarter and the forecast of growth of only 1.3% for the year mean that even a minor new shock could eliminate the expected growth. Sustainable recovery requires not only demand but also the physical expansion of energy, industrial, and logistics capacity,” Urakin said.
The inflation situation in May remained mixed. According to the NBU and the State Statistics Service, consumer inflation slowed to 8.2% year-on-year, compared with 8.6% in April. Prices rose by 0.9% over the month and by 5.8% since the beginning of the year. At the same time, core inflation accelerated to 7.9% year-on-year, compared with 7.6% in April. Processed food products rose in price by 10.4%, services by 13.6%, administered prices by 10.2%, and fuel by 38.7% year-on-year.
The slowdown in the headline indicator was primarily explained by weaker growth in raw food prices. Meat, eggs, certain vegetables, and fruit rose in price more slowly, although the cost of cereals continued to increase. At the same time, underlying inflationary pressure was intensified by high business costs for energy, fuel, and logistics; rising wages due to labor shortages; the pass-through of the previous weakening of the hryvnia to prices; and the rising cost of services.
The NBU’s April forecast envisaged inflation accelerating to 9.4% at the end of 2026. A return to a sustained decline was expected in 2027, when inflation was projected to slow to 6.5%, and to the target level of 5% in 2028.
As of the end of May, the key policy rate remained at 15% per annum. The latest decision at that time had been adopted by the Board of the National Bank on April 30. The NBU explained that maintaining the rate was necessary to preserve the attractiveness of hryvnia assets, keep inflation expectations under control, and maintain the stability of the foreign exchange market. The baseline forecast envisaged keeping the rate at 15% at least until Q2 2027, while the regulator allowed for additional measures if price pressure intensified further.
“The decline in headline inflation from 8.6% to 8.2% did not mean that the price problem had been resolved. Core inflation, on the contrary, increased to 7.9%, services rose in price by more than 13%, and fuel by almost 39%. With this inflation structure, a 15% rate remains a necessary safeguard for hryvnia savings and currency stability. Premature policy easing could quickly return inflation to double-digit levels,” Maksym Urakin emphasized.
The foreign exchange sector remained under control but required significant support from the regulator. As of June 1, 2026, Ukraine’s international reserves amounted to $45.727 billion, having decreased by 5.2% in May. This was the fourth consecutive monthly decline in reserves.
In May, the NBU sold $3.135 billion on the foreign exchange market, 12.4% less than in April. The government’s foreign currency accounts received $599.2 million, including $498.8 million from the World Bank and $100.4 million from the placement of foreign currency-denominated domestic government bonds. A total of $126.2 million was allocated for servicing and repaying public debt in foreign currency, while Ukraine paid another $274.9 million to the IMF. The reduction in reserves was partially offset by a positive revaluation of financial instruments and other transactions totaling $441.9 million. Despite the decline, the reserves covered 4.7 months of future imports.
“Four months of consecutive declines in reserves are no longer a one-off fluctuation but a trend that requires close monitoring. The level of $45.7 billion is still significant and provides sufficient external liquidity, but the foreign exchange market remains structurally deficient. The hryvnia’s further stability will depend on the regularity of international inflows, reduced dependence on energy imports, and increased export revenues,” Urakin believes.
According to the State Customs Service, Ukraine’s trade turnover amounted to $58 billion in January–May 2026. Imports reached $40.5 billion, while exports amounted to $17.5 billion. Thus, the merchandise trade deficit for the first five months totaled approximately $23 billion, while imports exceeded exports by 2.3 times.
Ukraine imported the largest volume of goods from China, worth $11.1 billion, followed by Poland at $3.9 billion and Türkiye at $2.7 billion. The main destinations for Ukrainian exports were Poland at $2 billion, Türkiye at $1.5 billion, and Italy at $1.1 billion.
In the import structure, machinery, equipment, and transport accounted for $17 billion, fuel and energy products for $6.4 billion, and chemical industry products for $5.7 billion. Together, these categories accounted for 72% of all imports. Exports were primarily composed of food products worth $10.6 billion, metals and products made from them worth $1.7 billion, as well as machinery, equipment, and transport worth $1.5 billion.
“The widening of the merchandise trade deficit to $23 billion over five months is one of the most serious warning signs for the balance of payments. A significant share of imports is related to defense, energy, and reconstruction and is therefore objectively necessary. The problem is that exports are not growing at a corresponding pace and remain excessively dependent on agricultural raw materials. Ukraine needs to transform equipment imports into new production opportunities; otherwise, the trade gap will continue to be financed by external assistance and reserves,” Maksym Urakin stressed.
The budget situation remained strained but under control. In January–May, UAH 1.36 trillion was received by the general fund of the state budget. Cash expenditures of the general fund amounted to UAH 1.8 trillion, 16.9% more than in the corresponding period of 2025. In May alone, general fund revenues amounted to UAH 318.7 billion, while expenditures totaled UAH 449.3 billion.
Security and defense expenditures reached UAH 1.14 trillion over the first five months, or 63.4% of all general fund expenditures. In May, UAH 287.1 billion was allocated for these needs. A total of UAH 702.1 billion was spent on remuneration for public-sector employees, including payroll charges; UAH 305.3 billion on subsidies and transfers to enterprises; UAH 296.5 billion on social security; UAH 205.9 billion on goods and services; UAH 143.8 billion on public debt servicing; and UAH 104.3 billion on transfers to local budgets.
International grants in January–May amounted to UAH 249.9 billion, including UAH 21.7 billion received in May. Overall, UAH 1.8 trillion was received by the general and special funds of the state budget over the first five months, while cash expenditures of the state budget amounted to UAH 2.25 trillion. Borrowing by the general fund totaled UAH 260.6 billion, while UAH 229 billion was allocated for public debt repayment.
“The budget continued to perform its core functions, but its structure is almost entirely subordinated to wartime needs. When 63.4% of general fund expenditures are directed toward defense and security, the state has very limited room for capital investment and long-term development. This is precisely why external financing must remain regular, while every hryvnia of domestic resources must work to strengthen defense capabilities, energy resilience, and the recovery of production,” Urakin said.
Global Economy
As of the end of May 2026, the global economy remained relatively resilient, but the inflationary and geopolitical environment continued to deteriorate. High oil and gas prices following the escalation of the conflict in the Middle East increased production and transportation costs, while the largest central banks refrained from further easing monetary policy.
In its April World Economic Outlook, the International Monetary Fund forecast global economic growth of 3.1% in 2026 and 3.2% in 2027, provided that the Middle East conflict remained limited in duration and geographical scope. The IMF warned that a longer war, a new energy shock, deepening geopolitical fragmentation, trade disputes, and high public debt could significantly worsen the outlook.
The US economy maintained positive momentum. According to the BEA’s third estimate, real GDP increased at an annualized rate of 2.1% in Q1 2026 compared with the previous quarter. In standard quarter-on-quarter terms, growth amounted to approximately 0.5%.
Investment, exports, and government and consumer spending made positive contributions.
At the same time, inflation in the United States continued to accelerate. According to the BLS, the CPI increased by 4.2% year-on-year in May, following 3.8% in April. Prices rose by 0.5% over the month. Core inflation stood at 2.9%, energy prices increased by 23.5% year-on-year, and gasoline prices by 40.5%. In May alone, energy prices rose by 3.9%, while gasoline prices increased by 7%.
The Federal Reserve did not hold an interest-rate meeting in May. Therefore, as of the end of the month, the federal funds rate target range remained at the level of 3.5–3.75% set on April 29. The Federal Reserve pointed to elevated inflation, rising global energy prices, and high uncertainty surrounding developments in the Middle East.
The eurozone demonstrated significantly weaker economic dynamics. According to the Eurostat estimate available in May, eurozone GDP increased by only 0.1% in Q1 compared with the previous quarter and by 0.8% year-on-year. This indicated the effective stagnation of the regional economy and its high sensitivity to energy and foreign trade risks.
Annual inflation in the eurozone accelerated to 3.2% in May, compared with 3.0% in April. In the European Union, it increased to 3.3%. According to Eurostat, energy prices in the eurozone rose by 10.8% year-on-year, services by 3.5%, food, alcohol, and tobacco by 1.9%, and non-energy industrial goods by 0.9%. Core inflation, excluding energy, food, alcohol, and tobacco, amounted to 2.6%.
The European Central Bank also did not hold an interest-rate meeting in May. As of the end of the month, the deposit facility rate remained at 2.0%, the rate on the main refinancing operations at 2.15%, and the marginal lending facility rate at 2.40%. At its April 30 meeting, the ECB emphasized that the risks of higher inflation and weaker economic growth had increased because of the energy shock.
In the United Kingdom, annual inflation remained at 2.8% in May, unchanged from April. Prices rose by 0.2% over the month. At the same time, ONS data indicated that core inflation accelerated to 2.6% and services inflation to 3.7%. Transport services and goods rose in price by 6.8% year-on-year, while motor fuel prices increased by 24.6%.
The Bank of England did not change its policy parameters in May, meaning that the Bank Rate remained at 3.75%. At the April 30 meeting, eight members of the Monetary Policy Committee supported keeping the rate unchanged, while one favored raising it to 4%.
“May confirmed that the cycle of rapid interest-rate cuts in the leading economies has effectively stopped. Inflation in the United States rose to 4.2%, in the eurozone to 3.2%, while the United Kingdom faced a renewed acceleration in the prices of services and fuel. For Ukraine, this means more expensive global capital, more cautious investor behavior, and additional imported price pressure through energy prices,” Urakin said.
China’s economy grew by 5.0% year-on-year in Q1 2026. Nominal GDP reached CNY 33.419 trillion. In May, the consumer price index increased by 1.2% year-on-year but declined by 0.1% over the month; average inflation in January–May amounted to 1.0%. Industrial production increased by 4.5% year-on-year, including a 15.1% increase in high-tech production.
At the same time, domestic demand remained weak. Retail sales declined by 0.6% year-on-year in May, although they increased by 1.4% in January–May. According to the NBS, fixed-asset investment decreased by 4.1% over the first five months, while foreign trade in goods increased by 15.3%. This confirmed the persistence of an imbalance between strong production and exports and restrained domestic consumption.
India maintained the highest growth rates among major economies. Following the transition to the new 2022/23 base year, the official preliminary estimate of real GDP growth in the 2025/26 financial year was 7.7%, while nominal GDP growth was estimated at 8.9%. In the fourth quarter of the financial year, real GDP increased by 7.8% year-on-year. The services sector, domestic consumption, construction, and public investment remained the main drivers.
Türkiye again faced strengthening inflation in May. According to TurkStat, consumer prices rose by 1.71% over the month and by 32.61% year-on-year. Since the beginning of the year, inflation amounted to 16.61%. The annual figure was slightly higher than April’s 32.37%, indicating the instability of the disinflation process. At the same time, Turkish GDP increased by 2.5% year-on-year in Q1 2026 and by only 0.1% compared with the previous quarter, indicating a loss of economic momentum.
Brazil demonstrated more balanced dynamics. In Q1 2026, GDP increased by 1.1% compared with the previous quarter and by 1.8% year-on-year, reaching BRL 3.3 trillion at current prices. In May, the IPCA index increased by 0.58% over the month, while annual inflation reached 4.72%, compared with 4.39% in April. Since the beginning of the year, prices have risen by 3.20%.
“China, India, Türkiye, and Brazil continue to demonstrate different development models. China maintains high growth rates through industry, technology manufacturing, and exports, but has weak domestic demand. India relies on services, investment, and the scale of its domestic market. Türkiye maintains growth, but its quality is undermined by inflation exceeding 32%. Brazil is developing more slowly but is attempting to maintain a balance between business activity and price stability. For Ukraine, the main conclusion remains unchanged: long-term growth is impossible without its own production, technological, and export foundation,” Urakin believes.
Conclusions
As of the end of May 2026, Ukraine maintained macrofinancial manageability, but the main indicators pointed to increasing risks. Real GDP decreased by 0.6% year-on-year in Q1, inflation accelerated to 8.6% in April, core inflation rose to 7.6%, and the key policy rate remained at 15%.
International reserves decreased to $48.2 billion, or by 7.3% over the month. The merchandise trade deficit for January–April reached $18.3 billion. General fund revenues of the state budget amounted to UAH 1.04 trillion, while expenditures totaled UAH 1.35 trillion. A total of UAH 854.1 billion, or 63.3% of all general fund expenditures, was allocated to security and defense.
“Positive factors included the substantial volume of reserves, controlled foreign exchange policy, international financing, resilient consumer demand, business adaptability, and the development of defense production. The main risks were the continuation of the war, destruction of energy infrastructure, rising fuel prices, labor shortages, weak exports, and the budget’s dependence on external assistance,” the founder of Experts Club emphasized.
The global economy also entered a more difficult period. The IMF forecast global growth of 3.1% in 2026 but warned that downside risks prevailed. Inflation accelerated to 3.8% in the United States and to 3.0% in the eurozone, while the central banks of the United States, the eurozone, and the United Kingdom kept interest rates unchanged. China grew by 5% in the first quarter, India maintained growth rates above 7%, while Türkiye again faced inflation exceeding 32%.
“May 2026 showed that Ukraine’s stabilization model remains viable, but its financial safety margin is shrinking. The simultaneous acceleration of inflation, decline in reserves, and widening trade deficit are signals that external assistance cannot be the sole foundation of economic resilience. Ukraine needs to transition from financing current survival to creating a new production model. It should be based on energy autonomy, the defense-industrial complex, agricultural processing, mechanical engineering, logistics, digital technologies, and exports of high-value-added products. Only such a transition can transform macrofinancial stability from a temporary safety cushion into a foundation for long-term development,” Maksym Urakin concluded.
The article presents the key macroeconomic indicators of Ukraine and the global economy as of the end of May 2026. The analysis was prepared using data from the State Statistics Service of Ukraine, the National Bank of Ukraine, the Ministry of Finance, the State Customs Service, the International Monetary Fund, Eurostat, the BEA, the BLS, the NBS, the ONS, TurkStat, IBGE, and other official institutions.
The full version of the monthly analytical and statistical product “Economic Monitoring” is available to Interfax-Ukraine clients.
Economic Monitoring Project Manager Maksym Urakin

The Experts Club analytical center analyzed the latest ranking of the world’s top universities, the Academic Ranking of World Universities 2026 (ARWU), known as the Shanghai Ranking. Mainland China became the largest university system by the number of higher education institutions represented in the ARWU, known as the Shanghai Ranking. The top 1,000 included 234 universities from mainland China compared with 187 universities from the United States.
At the same time, the United States continues to be significantly more strongly represented at the very top of the ranking.
The full list of countries and territories by the number of universities in ARWU 2026 (in descending order by the number of universities):
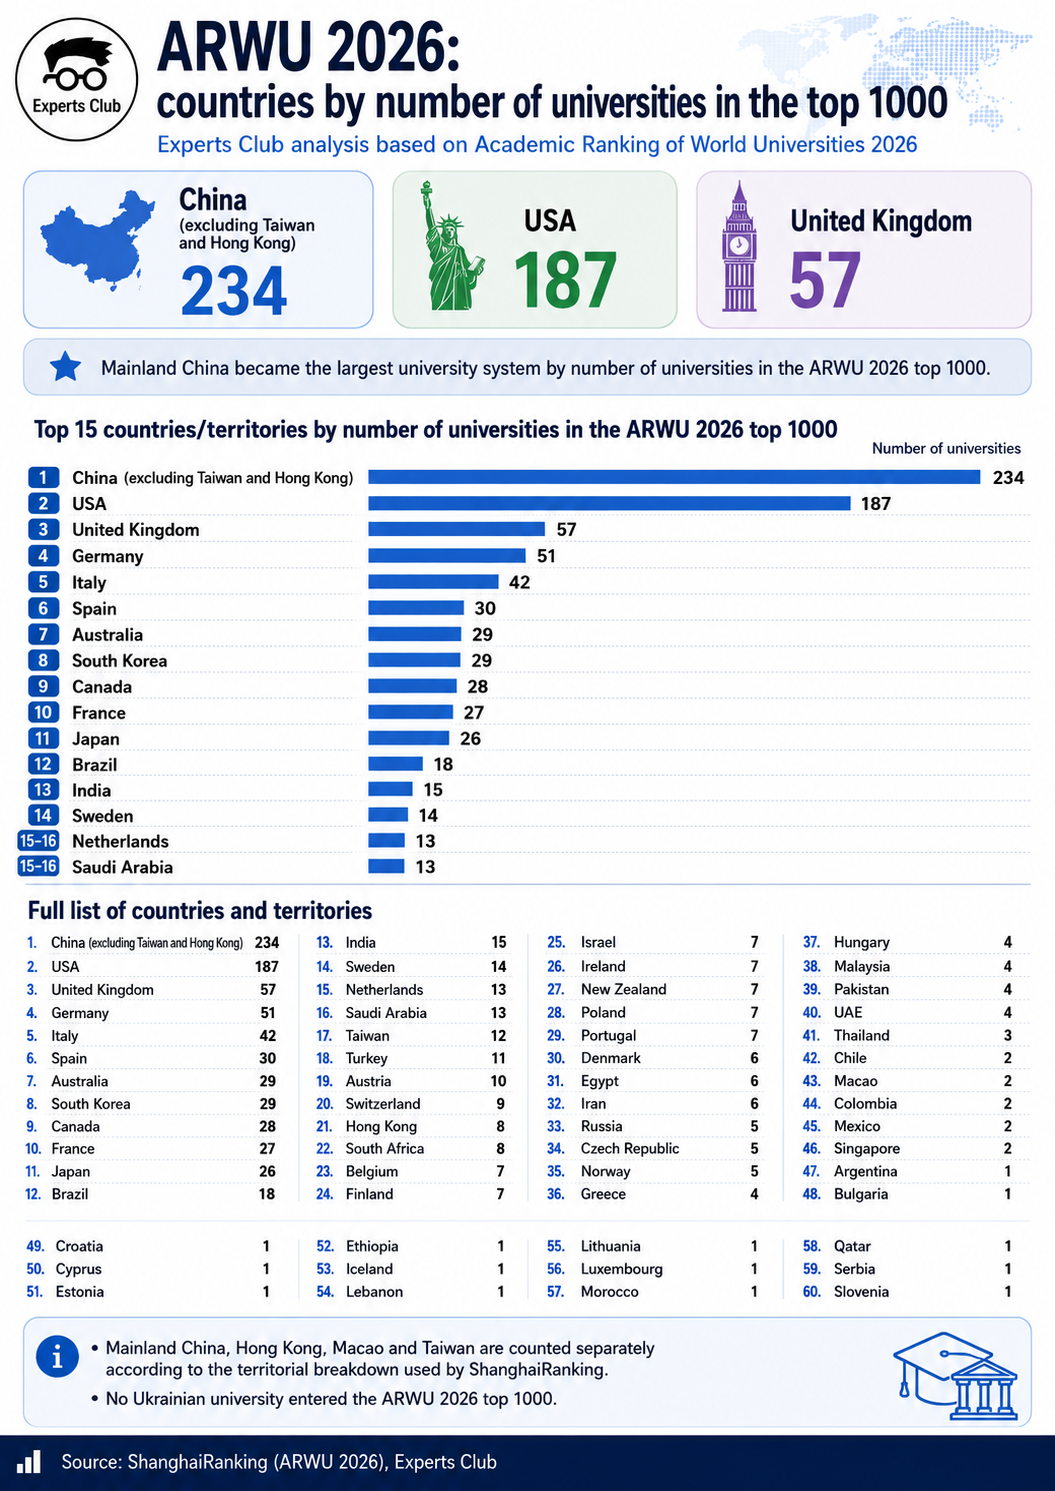
Mainland China, Hong Kong, Macao and Taiwan are counted separately here, in accordance with ShanghaiRanking’s territorial breakdown.
The structure of the ranking shows the further strengthening of Asia. In addition to mainland China, among the systems with the largest representation are South Korea with 29 universities and Japan with 26. Taiwan is represented separately with 12 universities, Hong Kong with eight and Macao with two.
ARWU evaluates more than 2,500 universities worldwide, but publishes only the top 1,000. Unlike a number of other global rankings, it focuses primarily on scientific and research performance rather than student reviews, reputation among employers or the quality of student life.
The final score is based on six criteria: alumni who are Nobel Prize and Fields Medal laureates account for 10% of the score; such laureates among staff – 20%; Clarivate Highly Cited Researchers – 20%; publications in Nature and Science – 20%; papers indexed in the Science Citation Index Expanded and Social Sciences Citation Index – another 20%; and academic performance per capita of an institution – 10%.
For ARWU 2026, the Highly Cited Researchers list released in December 2025, publications in Nature and Science for 2021–2025, as well as papers indexed in Web of Science in 2025, were used.
Therefore, the Shanghai Ranking is more accurately regarded primarily as an indicator of the research strength of universities and national scientific systems, rather than as a direct assessment of the quality of education or learning conditions for students.
No Ukrainian university was included among the world’s top 1,000 universities in this ranking.

Not a single Ukrainian university has made it into the top 1,000 in the world according to the 2026 Academic Ranking of World Universities (ARWU), published by ShanghaiRanking. Consequently, for the second year running, Ukraine has no representation in the main Shanghai ranking.
Ukraine is not included in the official list of countries and territories that have at least one university among the 1,000 best higher education institutions published for 2026. However, according to data from the Experts Club information and analysis centre, the list includes Poland, the Czech Republic, Hungary, Lithuania, Estonia, Bulgaria, Serbia, Croatia and Slovenia.
The same situation was observed in 2025 – Ukraine was also absent from the countries represented in the ARWU top 1,000.
The last time a Ukrainian university appeared in the main Shanghai Ranking was in 2024. At that time, Taras Shevchenko National University of Kyiv was ranked in the 901–1,000 bracket. The university’s official ShanghaiRanking profile still lists this result as its most recent inclusion in the ARWU.
The Shanghai Ranking does not directly measure the quality of teaching, student well-being or the employability of graduates. It is very strongly focused on the scale and international visibility of research.
In particular, the ARWU 2026 was compiled using the most highly cited researchers from the Clarivate list published in December 2025. For the indicator of publications in *Nature* and *Science*, papers from 2021 to 2025 were analysed, whilst publications indexed in Web of Science in 2025 were used to calculate total research output.
This means that, unlike previous editions of the ranking, the ARWU 2026 now features a significantly greater representation of research output from Ukrainian universities produced directly during the war. In the 2024 ranking, for example, the Nature and Science indicator covered the period 2019–2023.
However, it cannot be stated outright that Ukraine’s drop out of the top 1,000 was solely due to the war. The ARWU is a comparative global ranking: a university’s position depends not only on its own performance but also on how rapidly competing universities in other countries are increasing their research output and citation rates.
This competition is particularly evident in the case of China. By 2026, mainland China will already have 234 universities in the published top 1,000 and 16 in the top 100, whereas a year earlier there were 13 Chinese universities in the top 100.
For Ukraine, the situation serves as a telling indicator precisely in terms of international research competitiveness. Taras Shevchenko National University of Kyiv managed to break into the ARWU for the first time in 2024, but by 2025 it had dropped out of the top 1,000 and was unable to return to that ranking in 2026.
Source: ShanghaiRanking Consultancy, Academic Ranking of World Universities 2026.
The ranking assesses more than 2,500 universities and publishes the top 1,000.
EXPERTS CLUB, SHANGHAI-RANKING, UNIVERSITIES AROUND THE WORLD

According to the Experts Club information and analysis centre, Harvard University has once again topped the 2026 Academic Ranking of World Universities (ARWU), known as the Shanghai Ranking. It is followed by Stanford University and the Massachusetts Institute of Technology (MIT). Cambridge came fourth, and the University of California, Berkeley, fifth.
The top ten also included Princeton in 6th place, Oxford in 7th, Columbia University in 8th, the University of Chicago in 9th, and the California Institute of Technology (Caltech) in 10th. Thus, eight of the world’s ten best universities are located in the United States, with the other two in the United Kingdom.
The composition of the top ten did not change compared with 2025, although there were some shifts in positions. Princeton rose from seventh to sixth place, overtaking Oxford, while the University of Chicago moved from tenth to ninth, swapping positions with Caltech. Harvard, Stanford, MIT, Cambridge, and Berkeley retained the top five positions.
The best university outside the United States and the United Kingdom was France’s Paris-Saclay University, ranked 13th. Asia’s best university, China’s Tsinghua University, rose to 18th place. ETH Zurich ranks 19th, Peking University 22nd, while the University of Toronto and Zhejiang University share 24th place.
Despite the dominance of American universities at the top of the ranking, the most notable long-term trend remains China’s strengthening position.
In the ARWU 2026 top 100, the United States is represented by 37 universities, mainland China by 16, up from 13 a year earlier, and the United Kingdom by eight. They are followed by Australia and Switzerland with five universities each, France and Germany with four each, and Canada with three.
In total, universities from 18 countries and territories are represented in the top 100. At the same time, China’s position is strengthening rapidly: in ARWU 2025, mainland China had 13 universities in the top 100, compared with 16 now. Southeast University, Tianjin University, and Harbin Institute of Technology, in particular, entered the new top 100.
But the situation across the entire published top 1,000 is even more revealing. Mainland China is represented by 234 universities, compared with 187 from the United States. Thus, China already significantly surpasses the United States in terms of the breadth of its representation in ARWU, although American universities still maintain an enormous advantage at the very top of the ranking.
France has 27 universities in the top 1,000, four of which are in the top 100. In addition to Paris-Saclay in 13th place, PSL University ranks 33rd, Sorbonne University 55th, and Université Paris Cité 57th.
ARWU evaluates more than 2,500 universities worldwide but publishes only the top 1,000. Unlike rankings that take into account reputation among students and employers, internationalization, or the quality of the educational environment, the Shanghai Ranking is focused almost entirely on research activity.
Its methodology takes into account alumni and staff who are Nobel Prize and Fields Medal laureates, Highly Cited Researchers identified by Clarivate, publications in Nature and Science, the number of research papers indexed in Web of Science, and academic performance per capita. Therefore, ARWU is essentially primarily a ranking of universities’ research strength rather than the quality of education as such.
Not a single university from Ukraine appeared in this ranking.
The original source is ShanghaiRanking Consultancy, Academic Ranking of World Universities 2026, published on August 15, 2026.
EDUCATION IN CHINA, EXPERTS CLUB, SHANGHAI-RANKING, WORLD UNIVERSITIES

Following the reinstatement of mandatory statistical reporting in 2026, Ukrainian companies must once again comply with the data submission deadlines set by the State Statistics Service. However, as noted by the Experts Club Information and Analytical Center, the set of statistical forms varies by company and depends on the type of activity and whether the company is included in a specific government statistical survey.
How to Find Out What a Specific Company Must Submit
The State Statistics Service uses the “My Reporting” service, where an enterprise can check the list of forms for the statistical surveys in which it is included. A qualified electronic signature — QES — is required to obtain this information.
In addition, the official portal of the State Statistics Service has published the calendar for submitting state statistical survey forms and financial statements for 2026.
Depending on a company’s activities, the statistics authorities may request information on production, sales, services, the number of employees and wages, freight and passenger transportation, agriculture, foreign economic operations and other indicators. The list of forms for 2026 has been published by the State Statistics Service itself.
At the same time, financial statements must be submitted to the statistics authorities by legal entities that are required to maintain accounting records and file such statements in accordance with the law. The State Statistics Service specifically indicates this in its reporting calendar for 2026.
Do Individual Entrepreneurs Need to Report?
Most individual entrepreneurs do not submit statistical reports. However, an individual entrepreneur may be included in a particular state statistical survey depending on the type of activity. In this case, the relevant form appears in the “Respondent’s Cabinet” and must be submitted within the established deadline.
The State Statistics Service cites individual entrepreneurs engaged in industrial production and passenger or freight road transportation as examples.
How to Submit Reports
Reports may be submitted electronically through the official free “Respondent’s Cabinet” or through compatible specialised software. The Cabinet displays the forms applicable directly to a particular enterprise or individual entrepreneur, their submission deadlines and instructions.
What Penalties Are Provided For?
According to Opendatabot, citing the applicable administrative liability provisions, failure to submit statistical reports, violation of submission deadlines, or the submission of incomplete or inaccurate information is punishable by a fine of UAH 51–85 for individuals and UAH 170–255 for officials and individual entrepreneurs. Liability may be higher for a repeated violation.
In practice, the average fine imposed by the State Statistics Service in 2020–2025 amounted to approximately UAH 170. Over six years, 228 penalty orders totalling UAH 38,862 were issued.
Mandatory statistical reporting was fully reinstated on 5 July 2025. Therefore, in 2026, enterprises should no longer rely on the deferral regime that was in force during the first years of the full-scale war.
EXPERTS CLUB, penalties, State Statistics Service, STATISTICAL REPORTING

According to the Experts Club analytical center, citing data from the A-95 Consulting Group, the Ukrainian gasoline market continues to be concentrated around supplies from Poland and Lithuania: in July 2026, these two countries accounted for 55% of total imports.
Ukraine received 56,100 tonnes of gasoline from Lithuania and 51,700 tonnes from Poland. Together, this amounted to around 107,800 tonnes out of total imports of approximately 196,000 tonnes.
The Polish supply route is demonstrating particularly high growth rates. Compared with July last year, the volume of supplies increased by 68% and reached its highest level since August 2025.
Imports from Lithuania increased by 16% year-on-year.
The ORLEN oil refining group plays a key role in both supply routes. The group’s facilities in Poland and Lithuania supplied around 97,000 tonnes of gasoline to the Ukrainian market.
A-95 estimates ORLEN’s share at more than half of total imports. Comparing the rounded figures of 97,000 tonnes and the total volume of 196,000 tonnes, this represents approximately half of the market.
The high level of concentration has a dual effect.
On the one hand, the large and stable refineries in Poland and Lithuania allow Ukraine to rapidly increase purchases during periods of higher demand and compensate for the loss of other suppliers.
On the other hand, more than half of the available supply comes from only two geographical routes, while a very significant share of deliveries is linked to a single refining group.
Poland’s importance increased particularly after Ukraine switched to E10 gasoline. The change in standards limited the possibility of using some traditional sources, including certain Greek refineries.
At the same time, Greece has not disappeared from the market entirely. In July, Ukraine imported around 25,000 tonnes of gasoline produced by Motor Oil.
Germany became another rapidly growing supply route. It supplied 21,000 tonnes of gasoline, 78% more than in July 2025. The UPG network imported the entire volume.
Thus, the structure of imports in July demonstrates two parallel trends: ORLEN’s growing role as a key supplier and simultaneous attempts by Ukraine’s largest fuel retail networks to diversify purchases through Germany, Romania and Greece.



