
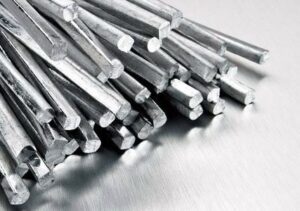
In January–August 2026, Ukraine increased its imports of tin and tin products 2.4-fold compared to the same period last year, reaching $6.352 million.
According to statistics released by the State Customs Service of Ukraine, imports of tin and tin products in August totaled $830,000.
Exports of tin and tin products in January–August 2026 totaled $740,000, and in August—$45,000, compared to $104,000 in January–August 2025.
As previously reported, Ukraine increased its imports of tin and tin products by 36.5% in 2025 compared to 2024, reaching $4.352 million. Exports of tin and tin products totaled $241,000, compared to $389,000 for the 12 months of 2024.
Tin is used primarily as a safe, non-toxic, corrosion-resistant coating, either in its pure form or in alloys with other metals. The main industrial applications of tin are in tinplate (tinned iron) for the manufacture of food packaging, in solders for electronics, in plumbing pipes, in bearing alloys, and in coatings made of tin and its alloys. The most important tin alloy is bronze (with copper).

Starting January 1, 2027, the UK will significantly reduce government support for the Homes for Ukraine program: monthly payments to British households providing housing to Ukrainians will drop from £350 to £100, according to The Guardian.
As a result, the so-called “thank you payment” will be reduced by 71.4%.
The new rules will apply to both current hosts already participating in Homes for Ukraine and new participants in the program.
At the same time, the British government is also cutting funding to local authorities responsible for implementing the program. The payment to municipalities per arriving Ukrainian will decrease from 5,900 to 3,300.
According to The Guardian, since the launch of Homes for Ukraine in March 2022, 181,000 of the approximately 234,000 Ukrainians who arrived in the UK after the start of the full-scale war have received support through the program. The British government has already allocated more than £1.81 billion to implement the program.
The funding cut is raising concerns among Ukrainians and host families about the program’s continued ability to provide free housing. Program participants interviewed by The Guardian said that the reduction in payments could force some hosts to withdraw from the program.
As one option for continued residency, the British government suggests that hosts could transition from their current status to a standard landlord-tenant relationship, under which Ukrainians would pay for their housing themselves.
This could be a particularly sensitive issue for elderly Ukrainians, people with disabilities, and low-income families, who would find it difficult to pay rent on their own in the British housing market.
It is important to note that the £350 is not rent paid to Ukrainians, but a government payment to the host household. Only one such payment may be made per address, regardless of the number of guests staying there.
For Ukrainians who have transitioned from the Homes for Ukraine visa to the Ukraine Permission Extension (UPE) program, payments to the host may be made for no more than 18 months from the date the guest first transitioned to UPE. After this period, the government’s “thank you payment” ceases.
Homes for Ukraine was launched by the British government on March 14, 2022. The program allowed UK residents to provide Ukrainians with housing in their homes or separate properties, while receiving a monthly compensation payment from the government.
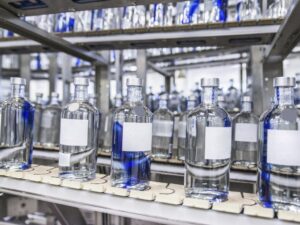
The Cabinet of Ministers of Ukraine has refined the procedure for determining the maximum production capacity of equipment used to produce ethyl alcohol and bioethanol, according to the industry publication SEEDS.
The government adopted the corresponding resolution on September 23, 2026. The new rules are intended to ensure a more accurate and technically sound calculation of equipment capacity. This metric is used to determine the guaranteed excise tax liability for alcohol and bioethanol producers.
In particular, the calculations now require determining the actual capacity of processing equipment and taking it into account. The regulations also clarify which changes to equipment should be considered a change in its maximum capacity.
The government has established a mechanism for performing the updated calculation and provided for the possibility of accounting for permissible deviations in actual capacity related to the specifics of the production process or the characteristics of measuring instruments.
One of the most significant changes is the allowance for actual production capacity of process equipment to deviate from the calculated maximum production capacity by up to 3% inclusive.
In addition, the procedure for applying coefficients related to the cleaning and disinfection of production equipment has been clarified. Calculations will take into account the possibility of performing such work during scheduled production shutdowns.
The government explains the need for these changes by citing the technological characteristics of the alcohol industry. The actual productivity of equipment may be influenced by the characteristics of the raw materials used, auxiliary materials, seasonal changes in energy source parameters, and other factors, which in and of themselves do not imply a change in the enterprise’s maximum technical productivity.
Thus, the updated procedure must simultaneously take into account both the technical characteristics of the equipment and the actual technological conditions of ethyl alcohol and bioethanol production.
The mechanism for determining maximum production capacity was introduced by Cabinet of Ministers Resolution No. 350 of March 28, 2025, in accordance with amendments to tax legislation regarding the specifics of excise taxation of ethyl alcohol and bioethanol. The calculation is performed by an authorized state agency based on the technical and technological parameters of production.
According to the government’s assessment, updating the methodology should increase the predictability of operating conditions for alcohol and bioethanol producers and ensure a more accurate determination of the indicators used to calculate excise tax liabilities.
ALCOHOL, Bioethanol, CABINET OF MINISTERS, EXCISE TAX, UKRAINE
The expansion of Ukrainian companies into foreign markets increases the importance of conducting preliminary checks on potential buyers and distributors. The risks are particularly high when working with a new counterparty on deferred payment terms, Dun & Bradstreet analysts note.
One of the tools for such checks is Dun & Bradstreet’s (D&B) international business information databases, which make it possible to identify a company, verify its registration data, ownership structure, financial indicators, operating history and associated risks.
When entering a new market, Ukrainian companies often focus primarily on finding a buyer and agreeing on commercial terms, while checking the buyer’s solvency remains a secondary task.
“Receiving an order does not yet mean receiving the money. For an exporter, a situation is particularly dangerous when the first large shipment is made to a new partner with deferred payment. Before signing such a contract, it is necessary to understand whether the company actually exists, how long it has been operating, what its financial indicators are, who its owner is and how high the credit risk associated with this counterparty is,” said Maksym Urakin, Director of Development and Marketing at Interfax-Ukraine, Head of the D&B-Interfax-Ukraine business unit, PhD in Economics.
Dun & Bradstreet has a global database containing information on hundreds of millions of companies. A unique nine-digit D-U-N-S Number is used to identify businesses, making it possible to distinguish between legal entities with similar names and link companies within corporate groups.
For a Ukrainian exporter, such a check is particularly relevant when working with companies that are offering a large contract for the first time, requesting a significant payment deferral or acting as intermediaries between the manufacturer and the end buyer.
Depending on the country and the availability of information, a D&B business report may contain registration details, information about executives and owners, financial statements, information on corporate relationships, credit ratings and other indicators used for risk assessment.
“The cost of a check is almost always incomparable with the potential loss from a single unpaid export shipment. International business information should be viewed not as an additional reference, but as one of the elements of the decision-making procedure regarding the credit limit, the amount of prepayment and the terms of the contract,” Maksym Urakin believes.
At the same time, negative information about a potential partner does not necessarily mean that the transaction should be rejected. It may serve as a basis for changing its terms — increasing the prepayment, reducing the size of the first shipment, using a bank guarantee, trade credit insurance or shortening the deferred payment period.
Dun & Bradstreet is an international provider of business data and analytical solutions whose history began in 1841. The company provides tools for business identification, counterparty verification, assessment of credit and commercial risks, compliance, supply chain management and work with corporate data.
The official representative of Dun & Bradstreet in Ukraine is the Interfax-Ukraine news agency. The specialized D&B-Interfax-Ukraine unit helps Ukrainian companies work with international business data, verify foreign partners and obtain a D-U-N-S Number.
Questions can be submitted through the specialized D&B resource — dnb.ua, by email at Urakin@interfax.kyiv.ua or by phone at +38 (044) 270-65-74.
COUNTERPARTY, D&B, DUN & BRADSTREET, EXPORT, UKRAINE, URAKIN
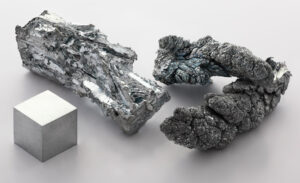
In January–August 2026, Ukraine reduced imports of zinc and zinc products by 35% compared to the same period last year, down to $24.126 million.
According to statistics released by the State Customs Service of Ukraine, imports of zinc and zinc products in August totaled $3.306 million.
Zinc exports for the eight-month period totaled $1,108 million; in August, they amounted to $189,000, compared to $888,000 in January–August 2025.
As previously reported, Ukraine reduced its imports of zinc and zinc products by 9.6% in 2025 compared to 2024, down to $52.982 million. Zinc exports last year reached $1.234 million, whereas in 2024 they totaled $563,000.
Pure metallic zinc is used to recover precious metals, protect steel from corrosion, and for other purposes.
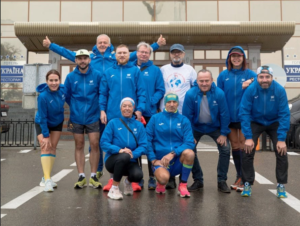
A team of Ukrainian and Slovak athletes set out from Kyiv to Košice as part of the Peace Run charity initiative, which aims to draw the attention of the European public to the ongoing war in Ukraine and support children affected by it.
The run began in Kyiv on September 24. According to the Slovak news agency TASR, citing one of the project’s organizers, Eduard Burash, the athletes will cover the approximately 1,000-kilometer route in a relay format. A total of 25 participants took the starting line in Kyiv, and Ukrainian and Slovak runners will take turns along the route.
Initially, the core of the project team consisted of five Ukrainian and five Slovak athletes. On their way to Slovakia, the participants will visit seven regional centers in Ukraine, including Uzhhorod.
Organizers expect the athletes to arrive in Košice on October 2. According to the official program for “Days of Ukraine 2026” in Košice, the Peace Run finish will be one of the event’s central sporting highlights.
The “Veterans’ Mile” holds a special place in the program; it will take place on October 3 in Košice City Park. Ukrainian war veterans will join the event, including servicemen who have suffered severe physical injuries, as well as participants with visual impairments. Representatives of the diplomatic corps are also expected to attend.
The final stage of the initiative will be the participation of Ukrainian athletes in the 103rd International Peace Marathon in Košice on October 4. The main marathon and the relay race will start at 9:00 a.m., and the half-marathon at 10:30 a.m.
The Košice Peace Marathon is considered one of the oldest marathons in Europe. The first race took place in 1924, and in 2026, the event will be held for the 103rd time.
The “Peace Run” is part of the 11th “Days of Ukraine” in Košice, which will take place October 1–4. The organizers have designated peace and an end to the war in Ukraine as the main theme of this year’s events. The project is being implemented by the FEMAN association in collaboration with partners from Ukraine and Slovakia, with financial support from the Slovak Ministry of Tourism and Sports.
As part of the Peace Run, a charity fundraiser is also being held to help children affected by the war.
Information about the project and the fundraiser: Peace Run Kyiv – Košice



