
Canada ranked first in terms of the balance of positive and negative attitudes among Ukrainians among Ukraine’s 50 largest trading partners, while China, which leads in trade turnover, received the lowest indicator, and attitudes toward Poland deteriorated significantly, according to the results of a study by Active Group and the Experts Club information and analytical center.
According to the published ranking, the balance of positive and negative assessments of Canada amounted to plus 73.8 percentage points. It was followed by Sweden – plus 70.6 p.p., the Netherlands – 69.7 p.p., Finland and Norway – 69.3 p.p. each, France – 69.1 p.p., Italy – 67.1 p.p., Lithuania – 65.9 p.p., Switzerland and the United Kingdom – 65.6 p.p. each.
This indicator is the difference between the shares of positive and negative responses. In particular, 76.3% of respondents have a positive attitude toward Canada, 2.5% have a negative attitude, and 19.2% have a neutral attitude.
The worst balance was recorded for China – minus 25.4 p.p.: 18.2% of respondents assess it positively, 43.6% negatively, and 33.9% neutrally. India also has a negative indicator – minus 14.3 p.p., Hungary – minus 12.7 p.p., and Lebanon – minus 9.2 p.p.
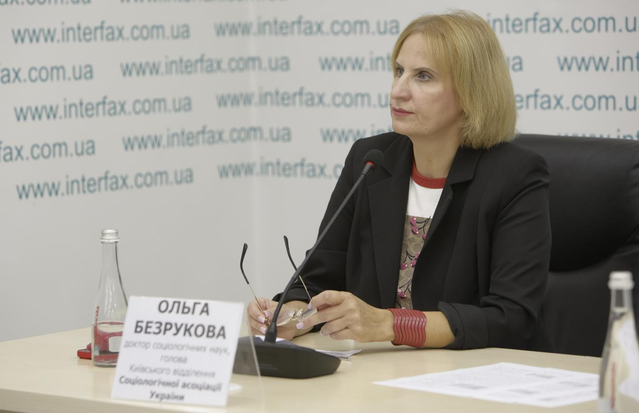
Doctor of Sociological Sciences and head of the Kyiv branch of the Sociological Association of Ukraine Olga Bezrukova called China an illustrative example of the gap between the scale of economic interaction and the country’s public image.
“We saw that China is Ukraine’s largest economic partner in terms of total trade turnover, but this is in no way converted into a positive public image. This shows that Ukrainian citizens clearly distinguish between the pragmatism of economic interaction and the overall assessment of a state. Economic dependence and interaction do not equal public sympathy for this country,” she emphasized at a press conference at the Interfax-Ukraine agency on Tuesday.
One of the most noticeable changes was the deterioration in attitudes toward Poland. While in March 2026 the balance of assessments stood at plus 41.7 p.p., in August positive and negative responses were practically equal, with a slight predominance of negative ones. A positive attitude was expressed by 34.6% of respondents, a negative one by 37%, and a neutral one by 25.4%.
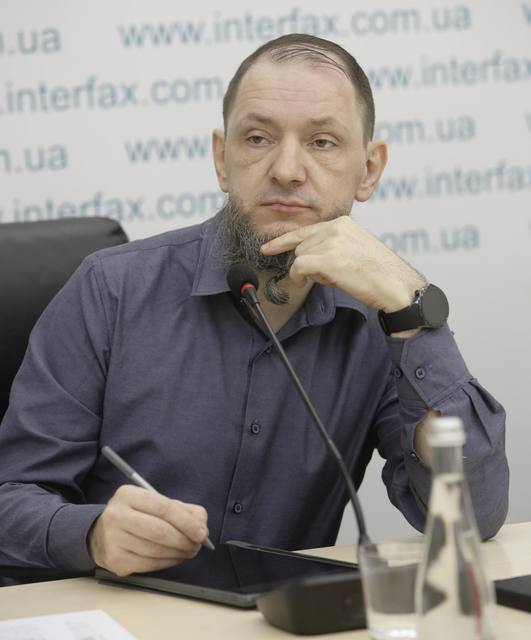
“At the beginning of the invasion, Poland was perceived almost as the main partner. We asked about the rapprochement between Ukraine and Poland, political and economic, even about uniting into some kind of common union, and we saw enormous positive results. But here we see: Poland seemingly still remains a key partner, but the idea of unification has already been forgotten, and we see stable negativity,” said Active Group founder Andriy Yeremenko.
He linked the deterioration in assessments to the position of part of the Polish authorities, which he considers anti-Ukrainian.
At the same time, the balance of attitudes toward Hungary improved from minus 33.6 p.p. in March to minus 12.7 p.p. in August, although negative assessments still prevail. For the United States, the indicator rose from plus 19.4 to plus 38.4 p.p. Some 55% of respondents have a positive attitude toward the United States, 16.6% a negative attitude, and 25.6% a neutral attitude.
When asked who contributes most to achieving peace in Ukraine, 44.6% of respondents named European Union countries, 25.2% the United States, 23.3% the United Kingdom, 4.1% China, 1.8% India, and 1% Brazil. Regarding priority development of trade and economic relations, 69.9% chose EU countries and the United Kingdom, 11.9% the United States, and 8.4% China.

According to Bezrukova, assessments of the U.S. role in achieving peace remained relatively stable throughout the three waves of the study.
“General sympathy toward a country and an assessment of its functionality at the international level are related but not identical things. Images of countries are multidimensional. A person may change their emotional attitude toward a state but continue to recognize its international weight,” the sociologist explained.
Another model, she said, is demonstrated by India: 48.3% of respondents express a neutral attitude toward it, but among formed assessments negative ones prevail – 31.5% versus 17.2% positive.
The economic indicators were presented by Experts Club founder, deputy director of the Interfax-Ukraine agency and PhD in Economics Maksym Urakin. According to State Customs Service data cited by him, in the first half of 2026 Ukraine’s trade turnover amounted to $70.3 billion, exports to $21 billion, and imports to $49.3 billion. The negative balance of trade in goods reached $28.3 billion.
“If we compare this with the first half of 2025, there was also an imbalance then, but now exports have increased by approximately 5%, while imports have risen by almost 30%. That is, the deficit increased by more than $10 billion over the year. Therefore, it is very important for us to analyze our main partners,” he emphasized.
According to the materials presented, trade turnover with China in January-June amounted to about $14.68 billion. Ukraine exported $778 million worth of goods to China and imported $13.90 billion, forming a deficit of approximately $13.12 billion. Poland remained the largest buyer of Ukrainian goods, with a volume of $2.38 billion. Türkiye ranked second among export markets with $1.78 billion, and Italy third with $1.28 billion.
In terms of total trade volume, China is followed by Poland – $7.05 billion, Türkiye – $4.90 billion, Germany – $4.48 billion, and the United States – $3.07 billion. Yeremenko highlighted Türkiye as an example of a combination of significant trade turnover and predominantly positive perception: 52.3% of respondents have a favorable attitude toward it, while 7.4% have a negative attitude.
Urakin separately drew attention to partners with which trade provides Ukraine with a positive balance. In the first half of the year, the largest was with Spain – $578.1 million, Egypt – $527.1 million, and Moldova – $467.2 million. They were followed by Algeria – $309.2 million, the Netherlands – $221.5 million, and Lebanon – $220.5 million. Libya, Tunisia, Iraq, and Yemen also entered the top ten.
At the same time, neutral attitudes prevail toward a number of these partners. Egypt is assessed neutrally by 61.3% of respondents, Algeria by 65.8%, and Tunisia by 67.3%. Participants in the press conference linked this to insufficient awareness among Ukrainians about these countries and emphasized the need for more active economic and public diplomacy.

“It is necessary to develop not only general awareness better. First of all, business associations, the Ministry of Economy and the Ministry of Foreign Affairs need to work to develop bilateral relations and improve the balance. In conditions where Ukraine already lacks financing and we live, essentially, at the expense of external borrowing, cooperation should be expanded with countries where we can have a positive balance,” said Active Group director Oleksandr Pozniy.
Urakin recommended that embassies accredited in Ukraine ensure full communication in the Ukrainian language, openness to the media, and regular reporting on the results of cooperation.
“The first recommendation is to regularly show concrete deeds, concrete actions, the presence here of foundations, embassies, teams, diplomats in the humanitarian sphere and in science. Second, to be open to questions and requests from the media and the public. We also need to use our sociology to draw conclusions and cement our relations, primarily trade relations,” he added.
This is the third wave of the study; the previous ones were conducted in August 2025 and March 2026. The survey was conducted in August 2026 using self-completed online questionnaires in the SunFlowerSociology panel. A total of 800 Ukrainian citizens aged 18 and over were surveyed. According to the organizers, the sample is representative by age, gender and region, and the stated maximum theoretical statistical margin of error at a 95% confidence level is 3.5%.
ACTIVE GROUP, CANADA, CHINA, EXPERTS CLUB, POLAND, PUBLIC OPINION, TRADE, UKRAINE, UNITED STATES
Imports of goods into Ukraine from January through August 2026 increased by 26% in monetary terms compared to the same period in 2025—from $52.6 billion to $66.3 billion, according to data from the Telegram channel of the State Customs Service (SCS) of Ukraine.
Exports, however, despite a 4% increase in January–July, slowed in January–August and remained nearly at last year’s level—$26.6 billion compared to $26.6 billion last year.
Meanwhile, taxable imports totaled $46.8 billion, accounting for 71% of the total volume of imported goods.
“The tax burden per kilogram of taxable imports in January–August 2025 was $0.6/kg,” the agency added.
The largest volumes of goods were imported into Ukraine from China ($19.6 billion), Poland ($6.3 billion), and Germany ($4.4 billion).
The largest exports from Ukraine went to Poland ($3.2 billion), Turkey ($2.1 billion), and Germany ($1.7 billion).
Of the total volume of goods imported in January–August 2026, 73% consisted of machinery, equipment, and transportation vehicles—$29.9 billion (customs clearance of these goods generated 168.1 billion UAH in budget revenue, accounting for 29% of customs revenue), chemical industry products—$9 billion (74.9 billion
UAH was paid to the budget, or 13% of customs revenue), and fuel and energy products—$9.5 billion (197 billion UAH was paid, accounting for 34% of customs revenue).
The top three most exported goods from Ukraine were: food products—$15.4 billion; metals and metal products—$2.7 billion; and machinery, equipment, and transportation vehicles—$2.4 billion.
In the first 8 months of 2026, customs clearance of exports subject to export duties generated 1.1 billion UAH in revenue for the budget, compared to 174.2 million UAH during the same period last year.
As previously reported, since July of this year, operations at the ports of “Greater Odesa” and their terminals have become significantly more difficult due to intensified attacks on ships and port infrastructure.

According to Experts.news, the structure of Ukraine’s dairy exports has changed significantly over the past year: the share of butter and other milk fats in foreign exchange earnings has more than halved, while dry and condensed milk have become the largest export category, according to an analysis by the Union of Dairy Enterprises of Ukraine (UDEU).
In August 2025, butter and other milk fats under commodity code 0405 accounted for 36% of the value of Ukraine’s dairy exports, whereas in August 2026, their share fell to 15%. At the same time, the share of dry and condensed milk increased from 24% to 37%, and that of whey from 5% to 11%.
The change in structure occurred gradually. Butter accounted for 36% in August 2025, falling to 25% in October, to 22% in March 2026, and to 15% in August. At the same time, the share of dry and condensed milk rose from 24% to 24%, then to 35% and 37%, respectively. Thus, the shift in the structure of Ukrainian dairy exports occurred primarily between the fall of 2025 and the spring of 2026.
According to the SMPU’s assessment, one of the factors was the situation on the global market for milk fats. Butter prices were under pressure, and the Global Dairy Trade index fell for nine consecutive auctions at the end of 2025. Since the export structure is calculated in value terms, the decline in butter’s share is linked not only to physical shipment volumes but also to changes in global prices.
At the same time, experts cite the growing role of whey as the most notable structural change. Its share of export revenue more than doubled over the year. By August 2026, dry milk, condensed milk, and whey together accounted for 48% of the value of Ukraine’s dairy exports.
The share of cheeses—which are considered higher-value-added products with potentially higher profit margins—remained virtually unchanged, at about 24% in August 2025 and 25% a year later. Thus, the structure of Ukraine’s dairy exports is shifting increasingly toward commodities and raw materials.
This trend is unfolding against the backdrop of a general deterioration in the dairy industry’s trade balance. According to data published by the Ukrainian Dairy Producers Association (SMPU) on September 2, Ukraine exported $176.9 million worth of dairy products in January–August 2026, which is 20.5% less than during the same period last year. At the same time, imports increased by 24.7% to $247.2 million.
In volume terms, butter exports fell by roughly half over the eight-month period, while shipments of dry milk and condensed milk decreased by 7%. At the same time, exports of fermented milk products rose by 28%, milk whey by 1.1%, and cheese by 0.9%.
As a result, Ukraine shifted from a trade surplus in dairy products to a trade deficit. For January–August 2026, the deficit totaled $70.3 million, whereas a year earlier the surplus had reached $24.1 million. The export-to-import ratio fell from 1.12 to 0.72.
On the import side, cheese remains the largest category, although its share in August fell year-over-year from 82.3% to 76.9%. At the same time, the share of imported milk and cream, whey, and butter increased, intensifying competition for Ukrainian processors in the domestic market.
The Union of Dairy Enterprises of Ukraine (SMPU) brings together Ukrainian milk producers and processors and represents the interests of companies in the industry. The organization was founded in 2001.
Original source: analysis by the Union of Dairy Enterprises of Ukraine on Ua Dairy
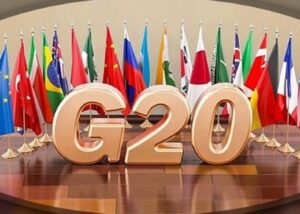
China was the only G20 country that did not support a number of provisions in the final document of the meeting of finance ministers and central bank governors of the “Group of Twenty,” held August 31–September 1, 2026, in Asheville, North Carolina.
As a result, instead of a joint communiqué agreed upon by all participants, the United States, as G20 chair, issued a chair’s statement. The official document from the U.S. Department of the Treasury states that it was endorsed by all G20 members present, except for China, which opposed four sections.
One of the main points of contention was the issue of global trade imbalances. The text, supported by the other countries, calls on nations to abandon non-market policies and practices that exacerbate imbalances. Countries with excessive and persistent external trade surpluses are urged to eliminate factors that constrain domestic consumption and create excessive dependence of economic growth on exports.
U.S. Treasury Secretary Scott Bessent stated after the meeting that China was the only dissenting participant. He called China’s current account surplus the largest and “unsustainable” and stated that a non-market economic model that constantly increases the supply of cheap export goods cannot be sustainable.
China also did not support provisions to expand the International Monetary Fund’s role in monitoring global economic imbalances. The other G20 members advocated for strengthening the IMF’s analysis, including an assessment of non-market policies, the factors driving external trade imbalances, and their impact on other economies.
Another point of contention was the Strait of Hormuz. The G20 statement expressed concern over ongoing disruptions to energy trade and emphasized the need for free, safe, and predictable shipping through the Strait of Hormuz and other key maritime routes. China opposed the entire relevant section of the document.
In addition, Beijing disagreed with the section concerning sovereign debt restructuring and the continued application of the G20’s Comprehensive Framework for Addressing the Debt Problems of Developing Countries. An official document from the U.S. Treasury Department explicitly states that China objected to paragraphs 4, 10, 11, and 13 of the statement.
Despite the lack of full consensus, the remaining 19 G20 members supported the approach to reducing global imbalances. Reuters notes that the issue has effectively turned into a debate over China’s export model, industrial subsidies, and the growing supply of Chinese products to global markets.
These disagreements come amid growing concerns from the U.S., the EU, and several other major economies regarding China’s manufacturing capacity and its expanding trade surplus. Western nations fear that a glut of Chinese industrial goods could intensify pressure on local manufacturers and increase dependence on specific supply chains.
The meeting in Asheville marked the second gathering of G20 finance ministers and central bank governors under the U.S. presidency in 2026. Key topics included economic growth, global imbalances, public debt, digital assets, financial literacy, and the state of the global financial system.
The G20 currently comprises 19 countries: Argentina, Australia, Brazil, the United Kingdom, Germany, India, Indonesia, Italy, Canada, China, Mexico, Russia, Saudi Arabia, the United States, Turkey, France, South Africa, South Korea, and Japan.
In addition, the European Union and the African Union are full members of the G20. Thus, following the African Union’s accession in 2023, the G20 effectively comprises 21 members—19 countries and two regional organizations.
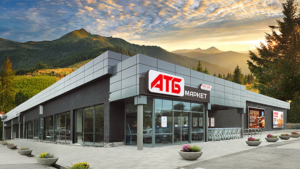
According to Experts.news, Ukraine’s largest retailers continued to increase their revenue in the first half of 2026, with the growth rates of leading chains in most cases exceeding that of the country’s retail market as a whole. ATB remains the leader in terms of revenue, while among the largest companies, Aurora and Fora posted the highest growth rates, according to an analysis by the Experts Club research center based on data from OpenDataBot.
As of mid-August 2026, there were 41,235 companies operating in the retail sector in Ukraine. Their number has been increasing for the fifth consecutive year. Since the beginning of the year, the number of registered retailers has exceeded the number of those that closed by 796 companies, which is practically in line with the pre-war level of net growth—804 companies over a comparable period. A total of 969 new companies were registered in 2026, 32% more than the previous year. (OpenDataBot)
To assess financial trends, OpenDataBot identified 2,073 companies that submitted financial statements for both the first half of 2025 and the corresponding period of 2026. Their combined revenue increased by 18%—from 692.29 billion UAH to 817.14 billion UAH.
The ranking of Ukraine’s largest retailers by revenue for the first half of 2026 is as follows:
ATB-Market – 135.99 billion UAH, up 16.1% compared to 117.15 billion UAH a year earlier.
Silpo-Food – 59.55 billion UAH, +18.2%.
Vygodna Kupka / “Aurora” – 28.26 billion UAH, +30.0%.
Fora – 26.83 billion UAH, +29.4%.
Comfi Trade – 20.16 billion UAH, +27.5%.
Novus Ukraine – 19.65 billion UAH, +20.6%.
RUSH / EVA – 18.02 billion UAH, +21.4%.
Metro Cash & Carry Ukraine – 17.70 billion UAH, +14.5%.
Petrol Contract / WOG – 16.35 billion UAH, +17.2%.
Omega / Varus – 13.72 billion UAH, +21.6%.
According to Experts Club’s calculations, the combined revenue of the top ten companies reached 356.23 billion UAH, an increase of approximately 19.7% compared to the first half of 2025. Thus, the top 10 grew slightly faster than the entire comparable group of retailers.
The ten largest companies accounted for about 43.6% of the total revenue of the 2,073 retailers included in the OpenDataBot sample. ATB and Silpo alone generated approximately 195.5 billion UAH, or nearly 24% of the total revenue of the entire group studied, while the top five companies generated approximately 270.8 billion UAH, or one-third of the total.
ATB remains the undisputed market leader: its revenue is more than double that of Silpo and nearly five times that of Aurora. Furthermore, ATB recorded the largest absolute increase in revenue—18.84 billion UAH over the year.
However, in terms of growth rates, “Aurora” and “Fora” stand out the most. “Aurora’s” revenue increased by 30%, or 6.52 billion UAH, while “Fora’s” rose by 29%, or 6.1 billion UAH. “Komfi” saw an increase of about 27.5%.
Outside the top ten in terms of revenue, FTD-Retail—which operates the “Foxtrot” chain—demonstrated strong growth, increasing its revenue by 4.47 billion hryvnia. OKKO-Light added 3.88 billion UAH, while Glusko Retail—whose gas station network is managed by Ukrnafta—added 2.76 billion UAH.
The financial results also reveal another trend. The combined profit of the companies surveyed grew by 17%—from 14.91 billion UAH to 17.44 billion UAH—but the number of profitable retailers decreased.
In the first half of 2025, 1,354 companies in the comparable group reported a profit; in 2026, that number dropped to 1,272. Their share fell from 65% to 61%.
This means that growth in the Ukrainian retail sector is becoming more concentrated. The sector’s total revenue and profit are increasing, and leading chains are posting double-digit growth rates; however, operating conditions remain challenging for some small and medium-sized companies.
According to Experts Club’s assessment, the discrepancy between the 18% increase in total revenue for the surveyed group and the decline in the share of profitable companies is particularly telling. It may indicate rising operating expenses, labor costs, logistics costs, rent, electricity costs, and financing costs, as well as intensified competition from the largest chains.
At the same time, the financial statements for the first half of the year do not yet reflect the consequences of subsequent massive Russian strikes on distribution centers, warehouses, and other infrastructure of Ukrainian businesses, a point specifically highlighted by OpenDataBot. Their impact may become apparent in the results of the coming quarters.
General government statistics also confirm the continued growth of the consumer market. As previously reported by Open4Business, citing the State Statistics Service, in January–July 2026, the physical volume of Ukraine’s retail trade turnover increased by 9% compared to the same period last year, while its nominal volume reached approximately 1.7 trillion UAH.
Retail turnover of legal entities grew slightly faster over the seven-month period, by 9.1%. In July alone, total retail turnover increased by 8.7% year-over-year and by 4% compared to June, while turnover of legal entities rose by 8.8% and 3.7%, respectively. Overall, Ukrainian retail grew by 8.1% in 2025, so the figures for the first seven months of 2026 indicate that consumer activity continues at a higher pace.

According to the “Serbian Economist,” Serbia’s economic ties with the European Union are now significantly more extensive than its trade with Russia, while Belgrade’s main dependence on Moscow remains primarily in the energy sector, said Andon Sapundži, Serbia’s ambassador to Ukraine.
According to him, about 70% of Serbia’s exports and imports go to European Union countries, with another approximately 15% going to countries in the region that are candidates or seeking to join the EU, including Bosnia and Herzegovina, Montenegro, North Macedonia, and Albania.
“The remaining countries account for the rest of Serbia’s foreign trade, including the United States, China, and Russia. Russia’s share is approximately 7–8%, and a significant portion of this trade consists of energy resources, primarily natural gas,” Sapundži said in an interview with “Apostrophe.”
According to him, dependence on Russian energy resources remains one of the most sensitive aspects of Serbian-Russian economic relations, which is why Belgrade is working to diversify its sources and supply routes.
Separately, the ambassador commented on the situation surrounding Serbia’s largest oil and gas company, NIS, which has come under U.S. sanctions due to Russian ownership stakes.
According to him, the process of changing NIS’s ownership structure is in full swing. Serbia is discussing the company’s future structure with Hungary’s MOL, while negotiations with Russia’s Gazprom Neft are ongoing. To finalize the deal, appropriate approvals under the U.S. sanctions regime are required, among other things.
Sapundži identified Serbia’s two main priorities as maintaining energy security and finding a long-term, sustainable ownership structure for NIS.
The company is of strategic importance to the country’s economy, as it operates Serbia’s only oil refinery in Pančevo.
At the same time, the diplomat emphasized that a change in trade structure does not mean Serbia is completely abandoning its economic relations with Russia.
Belgrade, meanwhile, continues to pursue EU accession. According to Sapundži, European integration remains a strategic priority for the country, although Serbia’s refusal to join sanctions against Russia is creating difficulties in negotiations with Brussels.



